17 Apr

Residential Market Update – April 16, 2018

General

Posted by: Adriaan Driessen

WEEKLY RESIDENTIAL MARKET UPDATE


Industry & Market Highlights

Canada’s Housing Market Continues Soft Landing
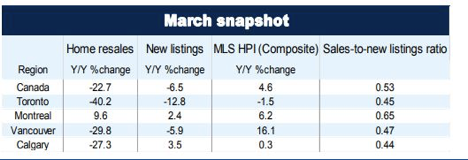
Data released today by the Canadian Real Estate Association (CREA) show a small uptick in home sales nationally in March, their first monthly increase in three months. This comes on the heels of a more than 19% decline in the previous two months as the tighter mortgage stress-testing rules at federally regulated lenders have reportedly impacted one in three potential buyers. The uptick in March sales suggests that the housing market is beginning to move beyond the payback period for activity pulled forward at the end of last year ahead of the new rules introduced on January 1, 2018.
The outlook for the housing market is likely to be uneven as the new market-cooling measures announced in the BC budget are poised to lengthen the adjustment process in that province. Indeed, home sales in Vancouver are still declining as resales dropped 8.6% in March from the prior month while benchmark prices again edged up 1.1%. Vancouver has not seen so few homes change hands since 2013. The February BC budget introduced a new speculation tax as well as an expanded foreign buyers tax, and a tax hike on home sales and school taxes for properties worth more than $3 million.
For the country as a whole, existing home sales inched up 1.3% from February to March. Nevertheless, national sales activity in the first quarter slid to its lowest quarterly level since the first quarter of 2014.
March sales were up from the previous month in over half of all local housing markets, led by Ottawa and Montreal. Monthly sales gains were offset by declines in B.C.’s Lower Mainland, the Okanagan Region, Chilliwack, Calgary and Edmonton.
Actual (not seasonally adjusted) activity was down 22.7% from record activity logged for March last year and marked a four-year low for the month. It also stood 7% below the 10-year average for the month. Activity came in below year-ago levels in more than 80% of all local markets, including every major urban centre except Montreal and Ottawa. The vast majority of year-over-year declines were well into double digits.
“Government policy changes have made home buyers and sellers increasingly uncertain about the outlook for home prices,” said CREA President Andrew Peck. “The extent to which these changes have impacted housing market sentiment varies by region,” he added.
“Recent changes to mortgage regulations are fueling demand for lower-priced homes while shrinking the pool of qualified buyers for higher-priced homes,” said Gregory Klump, CREA’s Chief Economist. “Given their limited supply, the shift of demand into lower price segments is causing those sale prices to climb. As a result, ‘affordably priced’ homes are becoming less affordable while mortgage financing for higher priced homes remains out of reach of many aspiring move-up homebuyers.”
New Listings
The number of newly listed homes rose 3.3% nationally in March. However, new listings have not yet recovered from the 21.1% plunge recorded between December 2017 and January 2018–the most substantial month-over-month decline on record according to the CREA. With sales up by less than new listings in March, the national sales-to-new listings ratio eased to 53% in March. The long-term average for the measure is 53.4%.
Based on a comparison of the sales-to-new listings ratio with its long-term average, more than 60% of all local markets were in balanced market territory in March 2018. There were 5.3 months of inventory on a national basis at the end of March 2018 – unchanged from February, when it reached the highest level in two-and-a-half years. The long-term average for the measure is 5.2 months.

Home Prices
On a national basis, the Aggregate Composite MLS Home Price Index (HPI) rose 4.6% y/y in March posting the 11th consecutive deceleration in y/y gains. This continued the trend that began last April when the province of Ontario announced its new housing measures that included a 15% tax on nonresident foreign homebuyers. The slowing y/y home price growth mainly reflects the trend for the Greater Golden Horseshoe. Prices in that region have stabilized or begun to show tentative signs of moving higher in recent months; however, year-over-year comparisons are likely to continue to deteriorate further due to rapid price gains posted one year ago.
Nationally, apartment condo units continued to show the highest y/y price gains in March (+17.8%), followed by townhouse/row units (+9.4%), one-storey single family homes (+1.3%). Two-storey single-family homes prices were down from a year ago (-2.0%), continuing the trend of the past year. Despite having stabilized over the second half of last year, y/y declines for single-family home prices may persist over the first half of 2018.
In the GTA, the Composite MLS HPI rose 3.2% y/y, which was driven by an 18.8% y/y rise in condo apartment prices and 7.5% growth in townhouse prices. Single-family detached home prices were down slightly compared to February 2017.
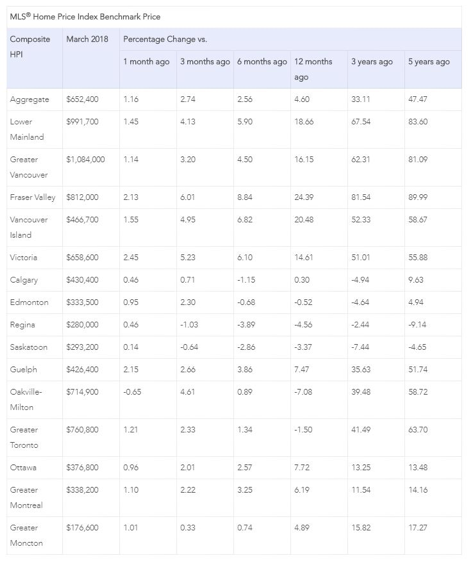
Benchmark home prices in March were up from year-ago levels in 9 out of the 14 markets tracked by the MLS® HPI (see the table below). Composite benchmark home prices in the Lower Mainland of British Columbia continued to trend higher after having dipped briefly during the second half of 2016 (GVA: +16.1% y/y; Fraser Valley: +24.4% y/y). Apartment and townhouse/row units have been driving this regional trend in recent months while single-family home prices in the GVA have held steady. In the Fraser Valley, single-family home prices have also begun to rise.
Benchmark home prices continued to rise by about 15% y/y in Victoria and by roughly 20% elsewhere on Vancouver Island.
Within the Greater Golden Horseshoe region of Ontario, price gains have slowed considerably on a y/y basis but remain above year-ago levels in Guelph (+7.5%). Meanwhile, home prices in the GTA and Oakville-Milton were down in March compared to one year earlier (GTA: -1.5% y/y; Oakville-Milton: -7.1% y/y). These declines primarily reflect price trends one year ago and mask evidence that home prices in the region have begun trending higher.
Calgary and Edmonton benchmark home prices were little changed on a y/y basis (Calgary: +0.3% y/y; Edmonton: -0.5% y/y). Prices in Regina and Saskatoon remained down from year-ago levels (-4.6% y/y and -3.4% y/y, respectively).
Benchmark home prices rose by 7.7% y/y in Ottawa (led by an 8.6% increase in two-storey single-family home prices). Prices shot up by 6.2% in Greater Montreal (driven by a 7.4% increase in two-storey single-family home prices) and by 4.9% in Greater Moncton (led by a 6.3% increase in one-storey single-family home prices).
Bottom Line
Housing markets continue to adjust to regulatory and government tightening as well as to higher mortgage rates. The speculative frenzy has cooled, and multiple bidding situations are no longer commonplace in Toronto and surrounding areas. Home prices in the detached single-family space will remain soft for some time, and residential markets are now balanced or favour buyers across the country. The hottest sector remains condos where buyers face limited supply.
Owing to the housing slowdown, a general slowing in the Canadian economy and significant trade uncertainty, the Bank of Canada will continue to be cautious.
Only 20% of investors expect the Bank of Canada to hike interest rates when they meet again on Wednesday. However, Governor Poloz will likely return to the rate-hike path in the second half of this year as inflation and growth are beginning to move higher. On a year-over-year basis, all measures of inflation have risen to the 2% range, and inflation will likely climb above the Bank’s 2% target pace in coming months, while growth should also return to an above-2% pace after a recent slowdown.
The Bank has maintained a cautious stance for months as inflation averaged only 1.6% last year, and the economy decelerated more than expected in the second half, amid signs that indebted households had begun slowing consumer spending. The economy grew at an annualized pace of 1.7% in the fourth quarter, versus economist expectations for 2% growth. Third-quarter gross domestic product growth was also revised lower.
After leading the Group of Seven in growth last year, the Canadian economy has lost momentum reflecting the slowdown in housing and longstanding productivity underperformance. The U.S. economy recorded growth rates of 3.2% in the third quarter and 2.5% in the last three months of 2017. Canada hasn’t trailed the U.S. in growth to this extent since early 2015, and the gap could well widen with this year’s U.S. tax cut favouring corporations.
But the environment is changing as inflation is likely to average 2.3% in the second quarter and 2.4% in the third as oil prices continue to rise. Nevertheless, most economists expect only two rate hikes this year–in July and October. That, of course, can change with incoming data surprises.

Dr. Sherry Cooper. Chief Economist, Dominion Lending Centres.

Residential Mortgage Commentary – The latest report from the CREA and the numbers for March
The latest report from the Canadian Real Estate Association certainly grabbed a lot of attention, especially the headline that said March sales plunged nearly 23% compared to a year ago. But, as always, the details provide a better picture of what is really happening.

A deeper look at the CREA numbers show sales for March 2018 were 7% below the 10-year average. This is a four-year low, but it is a long way from the 22.7% drop compared to the dizzying, record-setting highs of a year ago. Compared to February, March sales edged up 1.3%.

New listings improved by 3.3% in March. That put the sales-to-new-listings ratio at 53%, a little below the long-term average of 53.4%, but still well within the parameters of a balanced market.

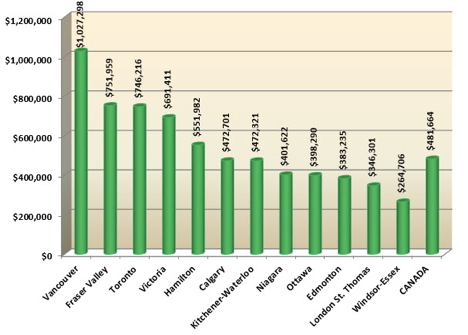
The other eye-catching number in CREA’s March report shows the national average price of a home tumbled more than 10% compared to a year ago. The overall, average price for a home of all types dropped to $491,000. Despite apparent price declines that number was still skewed by Vancouver and Toronto. With those two markets removed from the equation the national average price is $383,000 – a mere 2% decline from March of 2017.

CREA’s own MLS home price index shows gains are continuing to slow, but still registered a moderate 4.6% year-over-year increase in March. The report also shows unsold housing inventory has hit a two and-a-half year high at 5.3 months, which is in line with the long-term average of 5.2 months. By First National Financial.

Canadian Housing Starts
In March, the national trend in housing starts was stable for the fifth consecutive month, as diverging trends for multi-unit and single-detached dwellings continue to offset each other. Over this period, multi-unit starts have trended higher in most major urban centres while single-detached starts have trended lower.
The trend in housing starts was 226,842 units in March 2018, compared to 225,804 units in February 2018. This trend measure is a six-month moving average of the monthly seasonally adjusted annual rates (SAAR) of housing starts.
See the full CMHC report on Housing Start Data Here.


Economic Highlights

What are the latest real estate statistics and the results of the Business Outlook Survey?
Before I get into the latest breaking mortgage and fixed income news, it’s worth mentioning that both the NBA and NHL playoffs are starting this week. This year, only two Canadian teams made the Eastern Conference playoffs: the Toronto Raptors and the Toronto Maple Leafs. Since we’ve talked about the correlation between playoff success and GDP growth in the past, I am sure everyone in this great nation is cheering for Toronto teams to have championship seasons!
Rates
A little refresher on what happened to major rates since last week. The 5 year Government of Canada closed 2.00% even last Friday and is currently at 2.11% or 11bps higher. The 10 year had a similar move, closing at 2.14% last week and is about 2.25% as of writing. It is worth highlighting the 5-10 spread which has narrowed substantially from a year ago. In April 2017, the difference between 5 and 10 year GoC yields was 45bps and has been decreasing steadily to today, at around 14bps. A recent 10 year deal for CCL Industries, unsecured and rated BAA2/BBB, was priced at +165 over the 10 year, which exemplifies some tightness in the sector. The key takeaway is, 10 year borrowing rates do seem narrow compared to the 5 year, so it could be worth taking a look at longer term borrowing opportunities with your local First National commercial expert.
Business Outlook Survey and Rate Hikes
Next week, April the 18th, the Bank of Canada is scheduled to make another rate hike decision. The market was pricing no move in the overnight rate, while highly anticipating this Monday’s Business Outlook Survey (BOS) to see if it would move the needle at all. Basically, no, the needle was not moved. Currently, the probability of a rate hike next week sits at around 21% which was virtually unchanged by the BOS.
The Business Outlook Survey, which polls businesses around Canada, supported that the economy is solid, albeit not spectacular. The overall sentiment of the survey had businesses feeling positive about the economy. The majority of firms said sales grew over the last 12 months with many thinking about expansion. Capacity issues or the inability to meet demand, eased since the last survey from 56% to 47%, which is more akin to an economy working at full capacity. Another area of movement seen by business respondents was their inflation expectations. About 56% of respondents saw inflation at 2% or higher over the next two years, whereas the last report had only 38% of our job-creators seeing inflation above 2%. Major factors cited by the firms were increasing labour costs (minimum wage hikes) and higher commodity prices. The survey which occurred before the recent US and China trade tiff, also had 30% of respondents feeling they could be hurt by United States Policy going forward. Overall, the report reinforced that the economy is doing well and the Bank of Canada can use that in any which way they please.
Real Estate Statistics
In other news, this week had a plethora of real estate numbers come out. CREA home sales numbers came out today, with unit sales up 1.3% month over month nationally. GTA unit sales rose 2.1% month over month after two large previous declines of 24.9% and 7.9%. You could say this could be due to the implementation of B20 rules largely being baked in, but I won’t go there.
Housing starts also came out earlier this week. Interestingly, to probably 1,500 people nationally, the data released by Statscan was delayed by a day. Is that a big deal? I don’t know. Maybe we’ll send this out on Monday one day and see if someone notices. The March housing starts came in at 225,200, which was above consensus of 216,800, but below February’s revised 231,000. Overall, the decline was led by Toronto where multiples fell from 35k to 28.5k. Teranet data that came out also had the Home Price Index number decline 6.6% nationally, year over year.
In some mortgage news, The Canada Bankers Association released arrears stats Tuesday that showed only 0.24% of mortgages were in arrears. If that sounds low, it’s because it is and actually matches the lowest reading for arrears data since 2006. About 11,600 mortgages were in arrears for three or more months, out of 4.8 million mortgages.
Finally, working for Jason, I would be remiss if I didn’t mention that it’s Friday the 13th. No, that’s not in reference to Jason Voorhees of 90’s teen horror fame. It’s the traditional day where motorcyclist enthusiasts head down to Port Dover and celebrate all things motorcycle. Unfortunately, the weather doesn’t look ideal this year which is always a risk with a rolling celebratory date. However, if you are more of a fair weather rider and prefer: comfort, lack of speed and European aesthetics, national Vespa day is annually June 23rd. Sign me up. By Andrew Masliwec, Analyst, Capital Markets, First National Financial.


Mortgage Interest Rates
No change to Prime lending rate currently at 3.45%. Bank of Canada Benchmark Qualifying rate for mortgage approval is at 5.14%. Many lenders have started moving fixed rates upward with about 15 basis points, upward pressure on fixed rates continue. Deeper discounts are are available for variable rates making adjustable variable rate mortgages more attractive again.

Now’s the perfect time of year for a free mortgage check-up. With spring on its way and interest rates on the rise, it makes sense for us to revisit your mortgage and ensure it still meets your needs. Perhaps you’ve been thinking about refinancing to consolidate debt, purchasing a rental or vacation property, or you simply want to take a vacation. Whatever your needs, we can evaluate your situation and help you determine what’s right for you.

Adriaan Driessen
Mortgage Broker
Dominion Lending Forest City Funding 10671
Cell: 519.777.9374
Fax: 519.518.1081
riebro@me.com
www.iMortgageBroker.ca
415 Wharncliffe Road South
London, ON, N6J 2M3

Adriaan Driessen
Sales Representative & Partner
PC275 Realty Brokerage
Cell: 519.777.9374
Fax: 519.518.1081
adriaan@pc275.com
www.PC275.com
415 Wharncliffe Road South
London, ON, N6J 2M3

9 Apr

WEEKLY RESIDENTIAL  MARKET UPDATE 

General

Posted by: Adriaan Driessen

WEEKLY RESIDENTIAL  MARKET UPDATE 
Industry & Market Highlights 
Housing Affordability Increase First Time in 2 Years
There was an improvement in Canada’s housing affordability measure at the end of 2017.
It was the first time in two years that RBC Economics Research’s Housing Trends and Affordability Report has shown a decrease in its aggregate measure, albeit just 0.2 percentage points nationally to 48.3%.
As the measure is shown as the share of household income that would be required to carry the costs of owning a home at market price, a decrease indicates improving affordability.
Toronto saw a larger decrease in the measure, down 2.3 percentage points to 75.1%, but it is unlikely to have a meaningful effect.
“We expect the relief to Toronto ownership costs that ensued from the introduction of Ontario’s Fair Housing Plan to be short-lived,” said Craig Wright, Senior Vice-President and Chief Economist at RBC. “Our view is that Toronto prices will bottom out sometime this spring. Then we expect further interest rate hikes through the remainder of this year, which has the potential to stress housing affordability markedly in Canada.”
The report shows that affordability worsened in BC with Vancouver and Victoria both seeing higher prices in the last quarter of 2017, with the aggregate affordability measure rising 1.8 and 0.5 percentage points respectively.
“Unfortunately, Vancouver homebuyers are being challenged by the worst affordability levels ever recorded in Canada,” said Wright. “The costs of owning a home at today’s prices would have represented an astounding 85.2% of a typical household’s income in the fourth quarter. In this context, it wasn’t a surprise to see the BC government announced further housing policy initiatives to cool the market in its 2018 budget.”
Affordability also weakened in Montreal for the ninth time in the past ten quarters, denting its reputation as an affordable market.
The picture has changed little for housing markets in the Prairies and Atlantic Canada. Home ownership costs have remained largely stable though, a small increase in mortgage rates contributed to a slight deterioration in affordability within these regions in the fourth quarter. By by Steve Randall.
What is Influencing Interest Rates
April is Mathematics and Statistics awareness month.  Here’s a statistic.  The probability of Treasury Guy getting beat up by the commercial underwriters went up by 67% after mentioning Math and Statistics awareness month.
Raw Interest Rate Data
2yr GoC Yield:    1.82% (6 month high of 1.88%; 6 month low of 1.40%)
5yr GoC Yield:    2.03% (6 month high of 2.16%; 6 month low of 1.60%)
10yr GoC Yield:  2.18% (6 month high of 2.38%; 6 month low of 1.84%)
Stuff influencing Interest Rates
Last week, PM Justin Trudeau suggested that NAFTA talks have picked up momentum.  “We are having a very productive moment” he said.  Optimism that a NAFTA deal is within reach hasn’t filtered into expectations for a Bank of Canada interest rate hike yet.  Markets are currently placing only a 20%-25% chance of a hike at the central bank policy meeting on April 18th.  That’s down from as high as 55-60% six weeks ago.  Today’s net change in employment data came in a little stronger than expected at +32,300 vs. +20.000 Not enough to materially move rates or change BoC rate hike expectations though.   Hourly earnings ticked up 3.1% year over year and the jobless rate remained at 5.8%, which is a 40+ year low.
Down south, the change in non-farm payrolls came in on the softer side of expectations at +103,000 vs. +185,000.  Hourly earnings increased at 2.7% from a year earlier, matching projection, and the jobless rate remained unchanged at 4.1%.
New Issues and Credit Spreads
Ontario and Quebec both came to the market this week with 10yr bonds and Ontario was taught a tough lesson.  Quebec priced its issue 8bps tighter.  Ontario issued at GoC +73.5 bps and Quebec issued at GoC +65.5.  Vive le Quebec moins cher!  The provinces are rated the same but investors have traditionally demanded a little extra when lending to Quebec due to its higher debt load relative to the size of its economy.  Investors have also cited an intense dislike for the Montreal Canadiens.  Of course, Ontario’s planned budget deficits for the next six years may be a contributing factor too.  In either case, those spreads are about 15 bps wider than either province could issue at back in January.
Canada Mortgage Bond spreads have also been drifting wider since January.  CMB’s have gone from +26 to +32 but have outperformed 5 year senior deposit notes which have gone from +65 to +80 over the same time.
Closing thoughts
This ‘national walk to work day’ nonsense has me thinking.  I might try out this new fad called jogging this weekend.  I believe it’s jogging…or yogging; it might be a soft ‘j’.  I’m not sure but apparently you just run for an extended period of time.  It’s supposed to be wild.
Whatever you’re doing, remember, when it comes to the weekend, the question isn’t “what are you going to do,” the question is “what aren’t you going to do?” By Jason Ellis, Senior Vice President and Managing Director, Capital Markets, First National Financial.
LSTAR Market Statistics
The London and St Thomas Association of REALTORS® (LSTAR) announced 769 homes* were sold in March, down 37.9% over March 2017, which set a record for best March results since LSTAR began tracking sales data in 1978.
“The marketplace is still being challenged with low levels of housing inventory, which continues to impact sales across the region,” said Jeff Nethercott, 2018 LSTAR President. “Looking at inventory, there were 1,192 Active Listings, down 20.4% from this time last year and down 55.3% from March 2016. Similar to February, the March inventory is the lowest level for the month in the last 10 years.”
Average home sales price across London and St. Thomas continues to rise, despite the low inventory. The average March sales price in the region was $364,112 up 8.6% over March 2017. By geographic area, London South was $360,587 up 3.1% from last March. In London North, average home sales price was $438,827 up 7.1% compared to the previous year, while in London East, it was $291,161 an increase of 8.4% from March 2017. In St. Thomas, it was $295,980 up 18.5% over last March.
“Another interesting statistic that paints a picture of the marketplace is the sales-to-new listings ratio,” Nethercott said. “According to the Canadian Real Estate Association (CREA), a ratio between 40% and 60% is generally consistent with a balanced housing market. In March, London and St. Thomas had a sales-to-new listings ratio of 75.1%, which CREA says represents conditions in the marketplace that favour sellers. It reinforces the trends LSTAR Members have been experiencing, with low supply and high demand, and also managing multiple offer situations and out-of-town interest in our region.”
St. Thomas saw a total of 73 homes sold in March, down 29.1% from the same period last year. When looking at inventory, there were 42 active listings, down 51.2% from last March.
The following chart is based on data taken from the CREA National MLS® Report for February 2018 (the latest CREA statistics available). It provides a snapshot of how average home prices in London and St. Thomas compare to other major Ontario and Canadian centres.
 
According to a research report1, one job is created for every three real estate transactions and approximately $53,000 in ancillary spending is generated every time a home changes hands in Ontario. “Real estate makes a tremendous contribution to growing the regional economy and beyond, generating potentially more than $40 million right here in London and St. Thomas,” Nethercott said. “This broad impact also helped create approximately 256 jobs in March, further boosting the robust economic engine of southwestern Ontario.”  By London & St. Thomas Association of Realtors.  Click here to see the original News Release.
Economic Highlights
Market Commentary – Replace “If” with “When”
As we begin the second quarter of 2018 there can be no doubt left, we are in a rising interest rate environment.  Despite caution on the part of the Bank of Canada the improving economy in the United States and a more hawkish tone from the U.S. Federal Reserve have changed the discussion from “if rates rise”, to “when will rates rise and by how much”.
Interest rate increases in the U.S. have been pushing up the yields on government bonds there and in Canada, leading to hikes in fixed-rate mortgage costs.  The U.S. influence takes some pressure off the Bank of Canada to raise its policy rate.  It is worth noting that rising interest rates are not being handed to savers to the same extent that they are being passed on to borrowers.
A key factor in this will be inflation.  Both the American and Canadian economies are running near capacity and employment is strong; the two main drivers of inflation.  Canada just posted an annual inflation rate of 2.2%, topping the central bank’s 2% target, while U.S. inflation is running at 2.8%, also above target.
With the latest round of interest rate announcements behind us (the Fed bumped up a quarter point and the BoC was unchanged) analysts expect two, or maybe three more increases in the U.S. and two, or perhaps even just one, in Canada.  By First National Financial.
United States
·        Trade developments captured headlines this week. The U.S. disclosure of detailed plans regarding the tariffs on $50bn worth of Chinese imports led Beijing to retaliate with planned tariffs on $50bn of U.S. exports. The hardened Chinese stance led President Trump to threaten additional tariffs on $100bn worth of Chinese goods.
·        While the announced tariffs are likely to merely shave off about 0.2pp from annualized GDP growth in the U.S. over the next two years, the potential for the conflict to escalate to a full-scale trade war is much more concerning.
·        Economic data came in healthy with the ISMs holding near recent highs while auto sales came in slightly better than expected in March. Payrolls disappointed despite a healthy ADP print, but wage growth accelerated on the month.
Canada
·        It was a good week for the Canadian dollar despite the pullback in oil prices. The loonie was lifted by improved prospects of a North American trade deal, with a preliminary agreement on NAFTA 2.0 potentially as early as next weekend, when leaders gather for the Summit of the Americas in Peru.
·        Economic data was mixed. The trade deficit widened, with the weakness in net exports a drag on Q1 growth.
·        On the other hand, the Canadian economy added an impressive 32.3 thousand jobs. The jobless rate held steady at 5.8%, with wage growth accelerating to 3.3% y/y. Wages were up a solid 3.1% y/y for permanent employees.
By TD Economics.  Read the full report Here.
Mortgage Interest Rates
No change to Prime lending rate currently at 3.45%.  Bank of Canada Benchmark Qualifying rate for mortgage approval is at 5.14%.  No change in fixed rates.  Deeper discounts are becoming available for variable rates making adjustable variable rate mortgages more attractive again.
Other Industry News & Insights
Consumer Psychology Shift
The chief executive of Royal Bank says the housing market slowdown is a welcome shift in consumer psychology toward more caution.
David McKay told shareholders at the company’s annual meeting Friday that the bank is seeing a more balanced pricing trend after tighter conditions last year.
The Vancouver and Toronto region real estate boards, representing the country’s hottest markets, reported double-digit annual sales declines in March earlier this week.
B.C. and Ontario have introduced a series of measures to cool the housing market, including taxes on non-residents.
Further cooling pressure came from the federal level, including a financial stress test for buyers implemented Jan. 1 for federally-regulated lenders.
Both variable and fixed-rate mortgage rates have also risen as a result of moves by the Bank of Canada and fluctuations in the bond markets. By The Canadian Press, MortgageBrokerNews.ca
Social Media Impacts on Consumers
Banks are at risk of being pushed to the sidelines in the age of social media and big data, Royal Bank of Canada’s chief executive David McKay said Friday.
Customers are increasingly leaving a digital trail of their financial plans on social media or search histories, such as buying a house, allowing technology giants to not only capitalize on that information, but potentially get into banking themselves, McKay said.
“As these technology players realize their digital dividend there is a risk that our visibility with clients will diminish in the networked economies _ or ecosystems _ of the future,” he told shareholders at RBC’s annual meeting on Friday.
Technology continues to reshape the financial services landscape as more consumers do their banking online or via smartphone rather than in physical branches. McKay said Friday that mobile is now RBC’s number one digital channel, with 3.4 million active users, up 19 per cent over the last year.
In turn, Canada’s biggest banks have been investing heavily in technological innovation to stay ahead of the curve. During the last fiscal year, RBC spent more than $3-billion on technology, including on digital initiatives, cybersecurity and artificial intelligence.
And while smaller financial technology companies are both partnering with and competing with traditional banks, larger tech companies and their deep pockets present a more formidable threat.
Last month, for example, it emerged that Amazon was in talks with two large U.S. banks to start offering a chequing-like product to the e-commerce titan’s customers, according to the Wall Street Journal.
McKay said there is a risk that these companies in search, e-commerce or social may be the first to deduce what customers’ needs are and direct them to financial institutions willing to pay for that information, but also get into banking themselves.
“We think about somebody getting between you and your customer with that information, and start influencing the customer to choose other providers.”
He added that RBC, Canada’s largest bank, has identified a number of digital “ecosystems” where its clients live and work within which the bank believes it can play an “integral role in the future.”
McKay pointed to RBC’s recently released Drive app, which allows users to store car-related information, track trips and book service appointments.
“We’re preparing ourselves for a world where others can see what you are trying to do before we see it,” he told reporters. “So we have a number of strategies to make sure that we stay connected to our customers. So we understand what’s going on and we can be relevant.”
RBC is also investing heavily in artificial intelligence, and now has more than 200 data scientists working across the bank.
While data allows RBC and other companies to develop more relevant products and refine its approach to customers, it is important to balance this with transparency, McKay said.
The recent revelations that the Facebook data of millions of users was improperly shared with political consultancy Cambridge Analytica, among other things, has prompted a “healthy dialogue” about how personal information should be handled.
He said regulations may be needed to set the boundaries, but hoped that would not be necessary.
“We’re poised for a societal discussion on how we’re going to use personal information… The way I think that we have acted in the past, globally, as government, industries, whatever it happens to be, may not be sufficient to meet societal norms going forward.’’ by Armina Ligaya. Canadian Press.
Roundup of the latest mortgage and housing news.
From Mortgage Professionals Canada.
Open Access
Subscription May Be Required
Now’s the perfect time of year for a free mortgage check-up. With spring on its way and interest rates on the rise, it makes sense for us to revisit your mortgage and ensure it still meets your needs. Perhaps you’ve been thinking about refinancing to consolidate debt, purchasing a rental or vacation property, or you simply want to take a vacation. Whatever your needs, we can evaluate your situation and help you determine what’s right for you.
Adriaan Driessen
Mortgage Broker 
Dominion Lending Forest City Funding 10671
Cell:     519.777.9374
Fax:      519.518.1081
415 Wharncliffe Road South
London, ON, N6J 2M3
Adriaan Driessen
Sales Representative & Partner
PC275 Realty Brokerage
Cell:     519.777.9374
Fax:      519.518.1081
415 Wharncliffe Road South
London, ON, N6J 2M3
3 Apr

Residential Market Update

General

Posted by: Adriaan Driessen

WEEKLY RESIDENTIAL  MARKET UPDATE 


Industry & Market Highlights 

A Look At Rates, Inflation, Securitization News and More

Data released by Statistics Canada morning showed the annual pace of inflation accelerated to 2.2% compared to 1.7% the previous month.  Core inflation excluding volatile elements like gasoline prices climbed to 2.1% compared to 1.9% last month.

As you would imagine, inflation is a central piece of the information that influences the Bank of Canada’s interest rate decisions and, with both readings above the bank’s 2.0% target, another hike could come even sooner than previously expected.  Bond yields climbed 4-5 basis points on the news.

After leaving the target overnight rate unchanged at 1.25% back on March 7th, the implied probability of a 25 basis point hike at the April 18th meeting is about 40%.  Trade concerns with the US may yet weigh on that decision.

The Fed

Speaking of central banks, the Federal Open Market Committee (aka the Fed or FOMC) met on Wednesday and raised its benchmark target rate by 25 basis points for the sixth time since it began raising rates from near zero levels in December 2015.  The increase was widely expected and puts the new benchmark funds range at 1.50%-1.75%.  Along with the increase was another upgrade in the Fed’s economic forecast and the suggestion that the future path of rate hikes could accelerate.

Securitization

MCAP announced its highly anticipated Residential Mortgage Backed Security (“RMBS”) this week.  In case you’re unclear on the difference, an RMBS is composed of low ratio (<80% LTV) uninsured mortgages where NHA MBS are made up of Insured mortgages.

The $247 million Pass-Through deal features a $233 million AAA tranche supported by 6% credit enhancement through subordinated notes.  Indicated spread is in the GoC+100 range which is great value for the investor.  The prime collateral (not to be confused with ‘alternative’ or ‘alt-a’ mortgages) was carefully curated, and those willing to do the work to understand the asset, should be well rewarded.  While it might seem counterintuitive as a competitor, I’m definitely rooting for MCAP on this one.  The development of an RMBS market in Canada would be a good thing.

Two of the main actors that the Bank of Canada likes to watch took centre stage last week.  Both inflation and U.S. monetary policy played lead roles, but our central bank continues to wait in the wings.

Headline inflation in Canada jumped to an annual rate of 2.2% in February.  That is up sharply from the 1.7% annual rate recorded in January and it puts inflation above the central bank’s target rate of 2.0%.  Even core inflation crept above 2.0%.  Statistics Canada uses the average of three different measures of inflation, to strip-out the influence of volatile components like energy and food, to determine its core number.

In the United States the Federal Reserve moved forward with its tightening policy, raising its trend setting rate by a quarter percentage point.  The U.S. Fed rate is now running between 1.50% and 1.75%.  The Fed is also projecting U.S. inflation will finally climb above 2.0%.  Most market watchers are predicting three more Fed hikes this year.  In addition, China has raised a key, short term, interest rate and the Bank of England has made it clear it intends to raise rates as soon as possible.  (Although the BoE held its rate steady at 0.5% at its Thursday setting.)

Either one of these events – rising domestic inflation or increasing U.S. interest rates – would normally be a cue for the Bank of Canada to boost its benchmark, overnight rate.  But these are not normal times and the BoC is not likely to rise to the bait, just yet.

Canada’s February inflation numbers largely reflect the strong economic pace at the end of last year.  The Bank has already made three rate increases, to head off inflationary pressures brought on by that growth.  Since then the economy has slowed, easing those underlying inflationary pressures.

The increase in the U.S. Fed rate comes amid a lot of uncertainty for Canada, chiefly: the fate of the NAFTA renegotiations and high household debt.  That debt is a key concern for the Bank.

One consequence of the strengthening American economy and the tightening monetary policy is an increase in bond rates.  This has led to interest rate increases here, without any action by the Bank of Canada.    U.S. government bonds serve as the benchmark for bond prices around the world – particularly in Canada.  The increases there have seen the yield on Government of Canada five-year bonds increase by more than half a percentage point in recent months.  That has essentially added a quarter-point to market interest rates here in Canada, affecting mortgages and other borrowing costs.

The BoC is very mindful of these externally driven increases.  Given that Canadian households, on average, are carrying $1.70 in debt for every dollar of disposable income, the Bank is being very cautious about raising rates too far, too fast to avoid pushing those households over the fiscal cliff.  By Jason Ellis, Senior Vice President and Managing Director, Capital Markets, First National Financial.

Consumer Banking and Investing Complaints Soar in 2017.

Consumer complaints against Canada’s banking and investment industry took a jump last year.  The annual report from the Ombudsman for Banking Services and Investments shows banking related complaints hit a five year high in 2017.

OBSI saw a 28% increase in the number of dissatisfied banking customers it heard from.  Overall, for both banking and investment, the body opened a total of 721 cases, a 13% increase over 2016.  Of those cases, 370 were banking related and involved credit cards, mortgages and personal accounts.

Of interest to brokers, there were 67 mortgage complaints, accounting for 18% of the total of all banking related cases – a reduction from 24% in 2016 and 27% in 2015.  Key problems included pre-payment penalties and incorrect or incomplete information.

The industry funded ombudsman closed 349 of the 370 banking related cases it opened.  Customers received monetary compensation in 79 – or less than a quarter – of those cases (23%).  Nine of the complaints were settled with non-monetary compensation.

Overall, the total pay-out to banking customers was $165,000 while investment complainants received a total of $2,427,000.  Two of the country’s biggest banks are not included in the OBSI annual report.  They have opted-out of the group and use a private, third-party, dispute resolution firm. By First National Financial.

Canadian Data Release: Existing home sales fall to a five-year low as anxious buyers remain on sidelines

·       Canadian existing home sales fell for the second consecutive month, down 6.5% m/m in February – or about half of the January slump. Sales are now 16.9% below last year’s level and near levels last seen in early-2013.

·       The decline was widespread with four out of five national markets below last year’s levels. On a month-over-month basis, declines were seen in three-quarters of markets with just two provinces, P.E.I. (+2.98%) and N.B. (+0.79%) seeing gains. B.C. led the declines, down 12.7%, with the GVA down 15.8% and Fraser Valley down 16.3%. Calgary (-8.6%), the GTA (-8.2%) and several GGH markets including Hamilton (-12.1%) and Oakville (-8.8%)  were also down sharply on the month.

·       On the other hand, new listings rose robustly, up 8.1% on the month. All provinces by Sask (-4.0%) and Alta. (-2.0%) saw gains, with the Atlantic Region (+17%), Ontario (12.4%) and B.C. (11.0%) experiencing gains of double-digits.

·       With sales and listings moving in opposite directions, the ratio of sales to new listings plummeted to 55% from 63.7% in the previous month. The current ratio suggests that the national market is by-and-large balanced with all but three provinces in the 40% to 60% range typically considered balanced-territory. Both P.E.I. (65.8%) and B.C. (61.9%) pulled back, down 27.6pp and 16.9pp, respectively, but they remain the tightest markets in Canada. On the other hand, Newfoundland & Labrador (32.4%) and Sask. (42.4%) round out the bottom of the table.

·       The average home price fell for the second month straight, down 2.8% in February, to an 18-month low. Six provinces exhibited gains, but this was offset by the declines in P.E.I. (-6.8%), B.C. (-1.9%), N.B. (-1.4%) and Ontario (-0.7%). Moreover, the decline in activity amongst the priciest markets acted to drag down the price given the compositional change.

·       On a year-over-year basis, the quality adjusted MLS home price index decelerated from 7.7% to 6.9% as acceleration in GVA (up 0.3pp to 16.9%), Fraser Valley (up 1.7pp to 24.1%), Vancouver Island (up 1.1pp to +20.7%) and Montreal (up 1.0pp to 6.2%) was offset by cool-off in GTA (down 2.0pp to 3.2%), Oakville (down 0.7pp to -1.9%), and Guelph (down 1.6pp to 9.3%).

Key Implications

·        While the give-back related to the pull-forward in activity experienced late last year, as buyers rushed to close deals prior to the updated B20 rules, appears to have been largely complete in January, the softness in sales nonetheless persisted this month. We believe that much of it has to do with lingering uncertainty, with additional regulations introduced in the B.C. budget adding further tensions, along with B20 impacts and rising rates.

·       Despite a less-than-stellar headline, there were some modestly encouraging details in the report. While sales did drop, the pace of decline eased considerably relative to January. New listings also perked up a little during the month, suggesting rising confidence on the part of sellers after recent B20-related volatility.

·       All in, we expect policy-related turbulence and higher rates to negatively impact sales in the near-term, before some stabilization in activity begins to take hold mid-year. We look for prices to drop, on average, this year, though balanced-market conditions across much of the country should mitigate the magnitude of the decline. We expect conditions to improve next year, with price growth returning to the market alongside a rise in transaction activity.

By TD Economics.  Read the full report Here.


Economic Highlights


Last week: Bank of Canada, what will they do next?

The major news last week, which you all know by now, is that the Bank of Canada decided to keep their overnight interest rate unchanged earlier in March. If you are keeping track, that’s an 0-for-2 on interest rate increases this year by the BoC. If you were wondering, that’s a surprisingly worse record than my March Madness bracket, which is currently 10-for-16.  Overall, the BoC decision to keep the interest rate level at 1.25% was interpreted as ‘small dovish’, meaning they are kind-of-sort-of-maybe being cautious with hikes going forward. The statement released had many plagiarized lines from their previous statements, so you would have to split hairs to find any sharp leanings one way or the other on their stance. Luckily, bank economists thrive on hair splitting.

In brief, the statement largely re-iterated their data dependent tone which means any further action taken by the BoC will be driven by hard stats on wages, growth and inflation.  Of the few changes to the statement, housing got a shout out as the BoC stated ‘time’ will be needed to judge the impact of new housing measures.   The Bank of Canada also noted their growing uncertainty on Canadian and global economic outlooks due to trade policies.

Trade policy was the topic du jour last week as the hypothetical trade war targeting Canada/Mexico was called off by the USA. The aluminum and steel tariffs which dominated the news wires a couple weeks ago also came with exemptions for Canada and Mexico, as the countries strived to get NAFTA worked out. The markets reacted favourably as the Loonie gained off the 8-month lows seen earlier last week. However, the CAD is still the worst performing major currency this year.

It’s worth mentioning that last week also had employment numbers for Canada. As the BoC is increasingly seen as being ‘data dependent’, the report was not much of a needle mover. Last Friday’s February job’s data was a rebound from the -88k loss in January, but still came in under expectations of 21,000 new jobs vs 15,400 actual.  The unemployment rate came in at 5.8%, which is a historical low.  All of this begs the question, “When will the next interest rate hike come?” Well, firing up the CANADA-OIS Model, the market is predicting a 30% chance of increase in April and only 47% chance in May. Yawn.

This week: BIS and CMB’s

The major news this week was probably missed by most as its ‘March Break’ for many and information seeking is at an all-time low on the beach. Thankfully, for all the beach goers and office dwellers alike, this week was relatively soft on the economic news front.

A report came out on Monday which swept across many a sleepy trade floor. The BIS or Bank for International Settlements, noted that Canada was among the three countries to be flagged for signs of a potential banking crisis. This was raised before I’m pretty sure, but the report highlighted our high aggregate credit-to-GDP and total debt-service ratios.  It’s also worth noting that the Bank of Canada disagrees with some aspects of the flag-raising, as they have us in the amber and not red category, which is nice.

More importantly for all the commercial mortgage people out there, the new 5 year CMB was priced this Wednesday.  The new 2.35% June 2023 was priced at 32.5 Bps over the GoC 5 year. Pricing was wider by 0.5bps compared to last December’s 5 year auction. However, the new bond was tighter by 12.5bps compared to last year’s March 5 year auction (+45 bps).  Let us know if you can figure out why. The auction size was only $5 billion which is lower than the last four auctions which were all $5.25 Billion. The program is now running $500 Million below pace, which can suggest higher issuance going forward. Overall, demand for the 5 year CMB was strong, which is a good thing if you’re in the business issuing mortgages.

Finally, Saturday brings us one of the most celebrated holidays of the year: St. Patrick’s Day.  The day where everyone wears green and can trace back their lineage to Ireland. I suggest you read up on the holiday, there is a storied history and many interesting facts I didn’t know that I was planning on mentioning. However, as I was writing this up I read something that awoke a moment of self-realization and enlightenment, something I assumed you achieved only after years of study in the Himalayas. A Romanian court just rejected a man’s claim that he is alive and that, legally, he is dead. Are we all in a simulation? Is this real life? I’ll need another pint of Guinness.  By First National Financial Analyst, Andrew Masliwec, Capital Markets.

pastedGraphic_2.png

Mortgage Interest Rates

No change to Prime lending rate currently at 3.45%.  Bank of Canada Benchmark Qualifying rate for mortgage approval is at 5.14%.  No change in fixed rates.  Deeper discounts are becoming available for variable rates making adjustable variable rate mortgages more attractive again.


Other Industry News & Insights

Canadian Consumer Debt Reaches New High

Canadian households’ credit market debt reached a record high in the second quarter of 2017. This is debt from mortgages, lines of credit, home equity lines of credit, car loans, credit cards, and other consumer credit.

In CMHC’s national Mortgage and Consumer Credit Trends report for the second quarter of 2017, we continue to follow key credit market indicators. Highlights from the report show that, for the second quarter of 2017:

•consumers’ average monthly obligations increased for all major credit products relative to the second quarter of 2016. In particular, average non-mortgage obligations reached their highest level compared to the same quarter in all previous years since 2013.

•the average credit card balance per consumer increased to $2,910. This was a 1.1% increase from a year earlier. Also, this indicator has been trending up since the second quarter of 2014.

There were more encouraging findings, as well:

•The share of mortgage loans of which payment was in arrears for 90 or more days was at its lowest in 5 years.

•The average mortgage arrears rate decreased in all age groups in the second quarter of 2017 compared to the same period in 2015 and 2016.

•The share of outstanding mortgage loans held by consumers with a very good or excellent credit score reached its highest point since this data became available in 2012.

Overall, the data shows that consumers have a lot of confidence in using credit to make large purchases. However, this dependence on credit, coupled with a declining household savings rate, is worrying. These factors, together, mean that households have a lower capacity to manage their debts.

By CMHC.  Read the full Consumer Trend Report here.


Adriaan Driessen

Mortgage Broker 

Dominion Lending Forest City Funding 10671

Cell:     519.777.9374

Fax:      519.518.1081

riebro@me.com

www.iMortgageBroker.ca

415 Wharncliffe Road South

London, ON, N6J 2M3

Adriaan Driessen

Sales Representative & Partner

PC275 Realty Brokerage

Cell:     519.777.9374

Fax:      519.518.1081

adriaan@pc275.com

www.PC275.com

415 Wharncliffe Road South

London, ON, N6J 2M3