
Industry & Market Highlights
New CMHC study sheds light on rising house prices
In June 2016, CMHC launched a study to better understand the causes of rapidly rising home prices in major metropolitan centers across Canada. The report represents one of the most thorough examinations of house price patterns ever completed in Canada and is the result of advanced, data-driven analyses and engagement with stakeholders and government partners.
Why undertake this kind of study in the first place?
Housing affordability challenges exist in many centres throughout Canada. Rapidly rising house prices in high priced markets have benefited existing homeowners, but have also created challenges for first-time buyers. However, this is not just an issue for first-time homebuyers. Rapidly rising house prices also tend to drive rents higher and increase the cost of rental assistance and non-market housing solutions.
What were the study’s findings?
In conducting this study, it was important to look at both supply and demand. Very briefly, we found that:
- Strong economic and population growth, together with low mortgage rates, have been important drivers of house price growth in Canada
- The increase in average house prices in Vancouver and Toronto is also attributable to rising income inequality in these centres — price increases have tended to be greater for more expensive single-detached housing, rather than for condominium apartments
- Supply response to rising house prices has been weaker in Toronto and Vancouver, than in other Canadian metropolitan areas
What are the next steps?
The report represents an important step towards stimulating discussion across all levels of government, housing advocates, industry, academia, and the general public — with the full recognition that this is the beginning of a process of improving the functioning of Canadian housing market.
In Summary: Markets are, generally, behaving in accordance with fundamental economic rules like supply and demand (point 1). However supply in the two hottest markets is not keeping up (point 3). Point 2 speaks to the tendency of major urban centres to attract high wage jobs.
Toronto appears to be a contradiction though. Prices there rose by 40% between 2010 and 2016. CMHC says only about 40% of that increase can be attributed to economic fundamentals. On the other hand Vancouver saw a 48% increase in prices, but three-quarters of that can be explained by fundamental factors such as increased population, higher wages and low mortgage rates. By First National Financial.
Read the Full Report Here.
Toronto homeowners facing nearly 3% property tax hike
Toronto homeowners are in for a nearly three per cent property tax hike, as city council approved the 2018 budget on Monday.
Councillors voted 31 to 11 in favour of the budget, which included the 2.1 per cent property tax hike.
However, residents will have to pay an extra 0.5 per cent for the city’s build fund, which supports transit and housing projects, as well as an increase of 0.31 per cent as part of the city’s business climate and reassessment impact strategy. This brings the total residential property tax hike to 2.9 per cent.
For example, a homeowner whose home is assessed by the city at $624,418 will have to pay an extra $82 in municipal property taxes for a total of $2,907 for 2018.
Since taking office Mayor John Tory has been steadfast in his refusal to raise property taxes above the rate of inflation every year, which is what city council has done again this year.
However, some councillors are critical of the mayor and his unwillingness to hike taxes a little more.
“This is an election budget, it’s a band-aid budget, but more important, it’s an unsustainable budget,” Coun. Sarah Doucette said.
Coun. Mike Layton also believes the rate needs to be higher, in order to pay for what the city needs.
“We’ve decided to build this straw house, to build the unsustainable house, to go halfway on some of these measures to investigating in a really strong city,” Layton said.
There were some motions brought forth for the property tax hike to be greater, but they were voted down.
Aside from property taxes, the city will also be making a record high investment in transit this year, with $1.98 billion in the budget allocated for the TTC — that makes TTC funding about one-fifth of the city’s operating budget this year.
Budget details
Toronto city council approved a 2018 tax supported operating budget of $11.12 billion and a 10-year capital budget and plan of $25.98 billion. Some of the details, provided by the city, are below. Click here for more information on the budget.
The 2018 operating budget includes funding for new and enhanced services including:
- Additional 1,515 childcare subsidies, and support for the new Child and Family Centres Program
- 700 winter respite shelter beds
- Operation of three new permanent shelter sites
- Implementing TTC’s recommended two-hour time-based transfer policy on Presto
- $3 million to relieve overcrowding on TTC bus routes
- $1.3 million to implement congestion-fighting measures such as Traffic Enforcement Officers
Some of the new investments in the 10-year capital plan include:
- $279 million in interim capital funding to address the TCHC state-of-good-repair backlog and current revitalization projects to avoid permanent closure of its units
- $485.8 million for the George Street Revitalization project
- $178.6 million to acquire and construct nine shelter sites and renovate two leased sites over a three-year period that will add 1,000 new permanent shelter beds
- $6.4 million for a feasibility study of the Rail Deck Park, $3 million for the design and development phase of determining future uses of Old City Hall and $3.5 million to complete design work for the new Etobicoke Community Centre
- $46.7 million for critical state-of-good-repair projects such as the St. Lawrence Centre Roof project, Toronto Strong Neighbourhoods Strategy project and the Multi-Branch Renovation project of the Toronto Public Library
- $2 million to address critical waterfront rehabilitation due to high lake-effect flooding
City council also approved a 2018-2027 tax supported capital budget and plan of $26 billion, 72 per cent of which will be allocated to transit and transportation projects such buying buses and streetcars, expanding the subway, and fixing the Gardiner Expressway. By Toronto CityNews.
Real Estate Investment Trends to Watch Out for 2018
The latest wide-ranging market outlook released by Morguard Corporation painted a confident picture of the Canadian real estate investment segment’s robust activity this year, a trend fuelled by a healthy demand for quality assets.
“Investors remain enthusiastic about the Canadian commercial real estate market after a record volume of transactions in 2017,” Morguard director of research Keith Reading said during the release of the 2018 Canadian Economic Outlook and Market Fundamentals Research Report.
“There is a high supply of capital ready to be invested and Canadian commercial real estate is a proven performer. We are predicting another very busy and competitive market environment across the country in the coming year.”
The downtown areas of Vancouver and Toronto are projected to remain the most desired investment destinations in 2018. Suburban Toronto, Ottawa, and Montreal are also predicted to enjoy strong activity levels. And even Alberta, which had previously pulled down nationwide averages, is showing signs of renewed life.
“Intense bidding for a limited pool of downtown properties will force investors to look elsewhere for opportunity,” Reading stated. “Class A properties in suburban markets, particularly those near transit nodes, will be in high demand. Edmonton and Calgary will also see increased activity as investors look for high-quality assets in a recovering market and economy.”
“Long term, market-dominant retail centres should be able to alleviate immediate pressure on vacancy by providing prime space to new, high-growth traditional retailers and service retailers,” Reading added. “The fact remains that Canada is a country of shoppers, and recent positive economic and employment trends should drive healthy spending growth for the foreseeable future.” By Ephraim Vecina. The full report can be accessed here.
CHMC Says Policy Should Tackle Supply, Not Demand
The Canada Mortgage and Housing Corporation has published a new report on housing affordability in Canada’s biggest cities but admits it doesn’t have all the answers.
The agency found that escalating house prices are mainly driven by strong economic and population growth, and low mortgage rates; with Toronto and Vancouver lagging on the supply side.
While the two hottest markets showed large and persistent price increases during the analysis period of 2010-2016, Montreal saw only modest growth and the oil-dependent Calgary and Edmonton markets gained slightly.
Vancouver led the gains over the 6 year period with a 48% rise in house prices with population and disposable income rises, and low mortgage rates, accounting for almost 75% of that rise.
House prices increased by 40% in Toronto over the same time period with 40% of the rise being explained by conventional economic factors.
These price increases have tended to be for single-family homes rather than condo apartments. Supply of condos has been proportionately greater than for single-family homes.
“Large Canadian centres like Toronto and Vancouver are increasingly behaving like world-class cities,” said Aled ab Iorwerth, CMHC’s deputy chief economist. “Their strong local economies and historically low interest rates make them attractive to both people and industry which drives up demand for housing. When you have weak supply responses, as you do in these markets, prices have nowhere to go but up.
Although investor demand for condos has increased the rental supply, CMHC says that they tend to be more expensive than purpose-built rentals.
The report also highlights that measures to address the supply challenges are “more likely to have positive impacts than measures focused on the demand side.”
“While it is true that the supply response in Toronto and Vancouver has been significantly weaker than in other Canadian metropolitan areas, we do not fully know why this is the case,” said Evan Siddall, CMHC’s president and CEO. There continues to be data gaps and we need to work more closely with jurisdictions at all levels to fully understand what is happening.” By Steve Randall.
Is This The Crash? Gold, Silver & Bitcoin Update from Mike Maloney
Is this the beginning of a major crash? Join Mike Maloney for his latest update where he analyzes the stock market, gold & silver, and bitcoin. Watch the video here.
Are you a GoldSilver Insider? Mike released an earlier, Insider-only version of this video that reviews his latest investment moves and changes in his personal holdings. If you’re not an Insider, here are the details of this exclusive program.
The articles Mike references in this video:
- What Happens to Gold & Silver If the Stock Market Crashes?, by Jeff Clark, Senior Analyst, GoldSilver
- “Things to Come” Video, by Mike Maloney
- Technical Analyst Clive Maund’s Gold Update
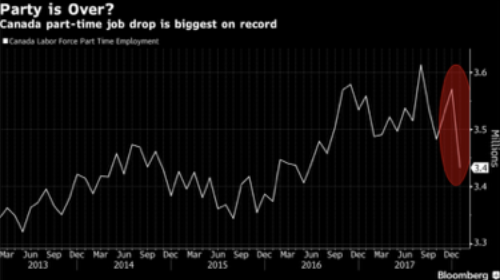
Jobs Decline In January Following Blockbuster Year

Canada shed 88,000 jobs in January, the most significant drop in nine years, driven by a record 137,000 plunge in part-time work. Full-time employment was up 49,000 while the unemployment rate increased a tick to 5.9%–only slightly above the lowest jobless rate since 1976. January’s sharp decline brings to an end a stunning 17-month streak of gains. While the top-line loss of 88,000 jobs is striking, it still only retraced about 60% of the 146,000 jump in the past two months.
The disappointing employment report will no doubt keep the Bank of Canada on the sidelines for a while, but it follows the most robust job market in 15 years. More than 400,000 net new jobs were created in 2017. Expectations are now that the Bank will hike interest rates cautiously, taking a pass at the March meeting.
Average hourly wages jumped 3.3% year-over-year, the strongest gain since March 2016. This was boosted by the rise in the minimum wage to $14.00 an hour in Ontario at the start of this year. Ontario now has the highest minimum wage in the country.
The largest employment losses were in Ontario and Quebec. There were also decreases in New Brunswick and Manitoba. Declines were spread across some industries including educational services; finance, insurance, real estate rental and leasing; professional, scientific and technical services; construction; and healthcare and social assistance. Employment increased in business, building, and other support services.
Canada’s economy has still seen employment increase by 288,700 jobs over the past 12 months — 146,000 of which came in November and December. Full-time employment is up 558,900 over the past 18 months, which is unprecedented.
Dr. Sherry Cooper
Chief Economist, Dominion Lending Centres
Ontario Ministry of Financing Updates to Land Transfer Tax
Land Transfer Tax -New tax statements about the Non-Resident Speculation Tax (NRST), solicitor obligations, and transferee recordkeeping requirements are required for the registration of Instruments requiring land transfer tax statements or land transfer tax affidavit. Ministry of Finance forms and Teraview, Ontario’s electronic land registration system, have been updated.
Also, a new form is available for NRST refund or rebate applications.
The above changes are outlined on the following webpages:
Refunds and Rebates of Land Transfer Tax

Economic Highlights
Canadian Data Release: Existing home sales slump in January as B20 rules bite
- Canadian existing home sales slumped 14.5% m/m in January, ending a five month streak of increases and erasing all the gains seen during this time.
- Only five of the twenty-six main markets experienced increases, with the group consisting of: Newfoundland & Labrador, Saguenay, Gatineau, Sudbury and Regina. On the other hand, fifteen markets experienced double digit percent declines. Ottawa (-32.6%), GTA (-26.6%) and Hamilton (-31.7%) led the pull-back with sharp declines also seen across the rest of the Greater Golden Horseshoe (GGH). Most B.C. markets also experienced significant decreases with Victoria (-17.1%), Fraser Valley (-14.8%) and GVA (-10.5%). Alberta and Manitoba markets also dipped lower, with Calgary (-15.3%), Edmonton (-14.9%) and Winnipeg (-10.8%) all down in double digits. Remaining Canadian markets were moderately lower.
- New listings were not to be outdone, slumping an even greater 21.6% nationally. Ontario and B.C. markets led the pullback with London (-44.8%), GTA (-39.3%), Fraser Valley (-38.8%) and GVA (-33.0%) topping the list. Only four markets experienced an uptick in listings – mostly markets that have also experienced an increase in sales.
- The outsized decline in listings led to a tightening of market conditions, with the sales to listings ratio up 5.3 points to 63.6% nationally. Most acute tightening was experienced in several GGH markets. The ratio surged in Kitchener-Waterloo (up 32.3 to 102.8%) and London (up 23.2 to 94.6%), with the GTA also up a healthy 9.7pp to 45.7%. Fraser Valley (up 26.3 to 93.6%) and GVA (up 19 to 75.7%) also tightened up sharply.
- The average home price declined 2.4% m/m, buckling the five month trend. It was a mixed bag across markets, half the provinces experiencing declines led by N.S. (-3.9%) while P.E.I. (+9.8%) and N.B. (+6.1%) lead the gains. Prices ticked down by 1.6% in Ontario and B.C. with values 4.2% lower in the GVA, while GTA prices were slightly softer, down 0.9%.
- The price decline was entirely due to the change in composition of properties sold, with GTA and GVA sales accounting for just 23.4% of national sales – down from 25.8% in the previous month. After seasonal adjustment, the national HPI rose 0.5%, with gains of 1.1% and 0.4% for GVA and GTA. On a year-over-year basis the national index decelerated from 9.2% to 7.7%. The trend was mirrored by the GTA HPI, which slowed to 5.3% from 7.3%, while the GVA HPI accelerated from 16% to 16.8%.
Key Implications
- This morning’s report was a highly anticipated oneas it gave us a glimpse of how the implementation of updated B20 rules impacted the Canadian housing market and how the market is faring in light of higher interest rates.
- On the whole, the numbers confirmed our expectations that B20 rules would pull-forward activity into late-2017, with sales slumping in January on the give-back. The pull-forward was further corroborated by the dynamics of new listings, which also increased ahead of the new rules, before properties being pulled-off. While it is too early to precisely estimate how much of the rise in late-2017 is related to the pull-forward, the report suggests that this dynamic accounted for much of it.
- The notion that pull-forward was central to the rise in late-2017 is further confirmed by the regional dynamics. The give-back was most apparent in Ontario and (to a lesser extent) B.C. – the two markets most affected by the B20 rules owing to their high prices and relatively large share of federally-regulated lending (particularly in Ontario).
- We expect some near-term volatility to persist in the market, as the fallout from the new rules and rising rates is absorbed by buyers and sellers, before some stabilization by mid-year. Thereafter we expect activity to remain weighed down byrising interest rates, but with markets largely in balanced territory prices should remain well supported. For our detailed forecast please click here.
By Michael Dolega, TD Economics Senior Economist
United States
- Major U.S. stock indices entered correction territory on Thursday but remain elevated relative to where they were a year ago. The sell-off was spurred by fears of higher interest rates, as the 10-year government bond yield hit a four-year high.
- The $300 billion increase in the spending cap over two years, laid out in the federal budget deal, could add to inflationary pressures at a time when the economy is already operating at close to full capacity, pressuring yields up further.
- Next week, investors will turn their attention to hard data, with advanced January retail sales providing an indication of whether or not first quarter growth will be affected by the residual seasonality.
Canada
- It was a sea of red in Canadian financial markets this week, with the S&P TSX, oil prices and the Canadian dollar all losing ground.
- Canada’s trade deficit widened in December, suggesting that net trade will be a drag on growth in the fourth quarter.
- Employment started the year off on a soft note, shedding 88k jobs in January. Losses were concentrated in part-time positions. The unemployment rate ticked up a point to 5.9%.
- Housing starts topped 200k units for an 8th straight month in January, despite some unfavourable weather conditions

Mortgage Interest Rates
No change to Prime lending rate currently at 3.45%. Bank of Canada Benchmark Qualifying rate for mortgage approval is at 5.14%. No change in fixed rates. No change in adjustable variable rates.

Other Industry News & Insights
Roundup of the latest mortgage and housing news.
From Mortgage Professionals Canada.
Open Access
- What’s Driving Canadian Homebuyers?(Canadian Mortgage Trends)
- Canadian home prices rise as Toronto sees first gain in 6 months(CBC)
- Home Capital Q4 profit sinks 40%, CEO says lender ‘turned the corner’(BNN)
- Andy Yan, the analyst who exposed Vancouver’s real estate disaster(Maclean’s)
- Toronto home prices climb for first time in six months: Teranet(BNN)
- Here’s what homebuyers can purchase with $500,000 in these major Canadian cities (BuzzBuzzNews)
- Yes the Canadian housing market is cooling, but it hasn’t been “too badly hit”: BMO(BuzzBuzzNews)
- ‘Mission accomplished’ on cooling markets, but affordability gap aiding ‘unequal society’: CMHC CEO(BNN)
- Gap between housing supply and demand largest in Toronto and Vancouver: CMHC(CBC)
- Bank of America Is Said to Explore Canada’s Uninsured MBS Market(Bloomberg)
Subscription May Be Required
- Supply shortages in Toronto, Vancouver left house prices ‘nowhere to go but up’(Financial Post)
- Mortgage rules ‘better than hoped’ but housing remains out of balance: CMHC CEO(BNN)
- Canada’s new home prices stall for first time since 2015(BNN)
- Canada January housing starts dip slightly, December new home prices stall(Reuters)
- Mortgages issued to non-permanent residents on the rise in Canada’s largest cities(BuzzBuzzNews)
- These Ontario housing markets have seen huge price spikes in the last decade (BuzzBuzzNews)
- How new mortgage rules hammer indebted households(Globe and Mail)
- Millennials’ prolonged stay at Parents Inn is having a profound impact on housing markets(Financial Post)
- Dividing the real estate market into ‘us and them’ would be a costly mistake for our economy(Financial Post)
- Pre-sale regulations in spotlight as hot GTA condo market leaves buyers out in the cold(Globe and Mail)
Now’s the perfect time of year for a free mortgage check-up. With spring on its way and interest rates on the rise, it makes sense for us to revisit your mortgage and ensure it still meets your needs. Perhaps you’ve been thinking about refinancing to consolidate debt, purchasing a rental or vacation property, or you simply want to take a vacation. Whatever your needs, we can evaluate your situation and help you determine what’s right for you.