20 Nov

WEEKLY RESIDENTIAL MARKET UPDATE

Real Estate Market Update

Posted by: Adriaan Driessen

Industry & Market Highlights 

CMHC 2018 Consumer Survey

CMHC’s 2018 Consumer survey provides insights to what consumers are doing in the mortgage and real estate industry.

Link here.

MPC Mortgage Professionals Canada Q3 Housing Market Digest

Get third quarter housing market information for Canada and each region including resale market data, housing stats, employment trends and interests rates from the latest Housing Market Digests.

Link here.

CMHC issues forecast for next two years

The Canada Mortgage and Housing Corporation forecasts a balanced market in the GTA through 2020, with fewer sales expected because of rising interest rates.

“As much as sales are going to come down slightly, we’ll see house price growth be more or less in line with inflation, not the double-digit kind we were accustomed to a few months ago,” said CMHC’s Manager of Market Analysis (Toronto) Dana Senagama. “We’ll likely see higher price growth in the downtown cores of some major GTA areas, like Toronto, Markham and Mississauga, where there are higher concentrations of condominiums.”

Resales will also dip through the end of 2020, added Senagama, due to rising mortgage rates.

The region’s low-rise housing market is forecasted to see a downturn primarily because of land scarcity. However, in suburban areas, like Peel, Durham and York Regions, there will be higher concentrations of single-family detached sales and listings, and that will slow price appreciation.

“There’s not enough serviceable land out there for low-rise homes for singles and townhomes,” said Senagama. “The vast majority of units under construction—about 55,000 of 71,000 units—are high-rise, and that means there are only a finite number of resources, both in terms of machinery and skilled labour. That’s going to affect delivery; the logistics won’t allow it.

“In terms of new construction, the story is going to be more and more condos, and that seems to be where the push is both in terms of policy shift in government and higher house prices dictating demand towards high-rise construction because low-rise is out of reach for first-time buyers, and when the average price is over $1 million, it’s not an easy entry point for any buyer.”

Through this year, Vancouver has born witness to softening home prices across all market segments, and that trend is expected to continue, according to CMHC.

“Over the next two years, we expect the resale market will be characterized by lower sales, higher inventories of homes for sale, and lower home prices compared with the recent market highs in the last two years,” said Eric Bond, CMHC’s principal market analyst for Vancouver. “With the resale market,

expect housing starts to decline in the Vancouver CMA over the next two years, and the majority of the decline will be in the multi-family segment, and specifically in high-rise.” By Neil Sharma.

Interest rate signs point up

As expected the Bank of Canada has boosted its trend-setting overnight rate by a quarter of a percent to 1.75%.  It is the 5th hike since rate increases began in mid-2017.  The bank rate is now above 1.5% for the first time since December 2008.

The central bank has also signalled its intention to continue raising rates.  In the statement that accompanied the October 24th setting the Bank dropped the word “gradually” from its description of the pace of future increases.

That change has some market watchers forecasting that the BoC is planning a string of consecutive increases, which could start as early as December.  The Bank also says its rate will have to rise to its “neutral stance” in order to keep inflation in check.  Right now the Bank estimates “neutral” as being 3%.  A “neutral” rate is one that is neither stimulating nor suppressing the economy.

The central bank also addressed one of its key concerns about the Canadian economy: the imbalance in the household debt-to-income ratio.  It still stands at about 170%, or $1.70 of debt for every $1.00 of take-home pay.  However, the Bank says those imbalances – while still elevated – are edging lower as Canadians make adjustments to earlier interest rate increases and tougher mortgage rules.

The Bank expects consumer spending to remain strong, but says it will be supported by rising wages and confidence rather than low interest rates and debt.  By First National Financial.

Canadian Home Sales Weakened In October

Statistics released today by the Canadian Real Estate Association (CREA) show that national home sales declined for the second consecutive month in October, edging back by 1.6% month-over-month (m/m) and down 3.7% from year-ago levels. Year-over-year sales in October are now about in line with their 10-year monthly average (see chart below). Existing home sales activity has picked up from levels early this year, but it is still considerably below the boom days of 2016 and early-2017 before the foreign purchase tax was introduced in Ontario (in April 2017), the new OSFI rules were implemented (in January 2018), and Bank of Canada tightening gained momentum.

Home transactions last month declined in more than half of all local markets, led by Hamilton-Burlington, Montreal and Edmonton. Although activity did improve modestly in many markets, it was offset by a decline in sales elsewhere by a factor of two. On a year-over-year (y/y) basis, sales were down in slightly more than half of all local markets as lower sales in Greater Vancouver and the Fraser Valley more than offset the rise in sales in the Greater Toronto Area (GTA) and Montreal by a wide margin.

New Listings

The number of newly listed homes edged down 1.1% between September and October, led by the GTA, Calgary and Victoria. The decline in new supply among these markets more than offset an increase in new supply in Edmonton and Greater Vancouver.

As for the balance between sales and listings, the national sales-to-new listings ratio in October came in at 54.2% — close to September’s reading of 54.4% and its long-term average of 53.4%. Based on a comparison of the sales-to-new listings ratio with the long-term average, about two-thirds of all local markets were in balanced market territory in October 2018.

There were 5.3 months of unsold inventory on a national basis at the end of October 2018. While this remains in line with its long-term national average, the number of months of inventory is well above its long-term average in the Prairie provinces and in Newfoundland & Labrador, where downward pressure on home prices is likely to continue. By contrast, Ontario and Prince Edward Island are the two provinces where the measure remains more than one standard deviation below its long-term average pointing to stable prices or modest gains. In other provinces, the number of months of inventory is closer to its long-term average and suggests that sales and inventory are well balanced.

Home Prices

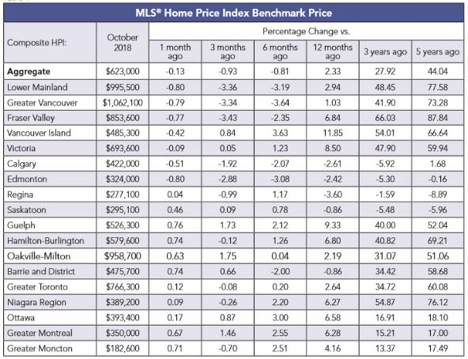
The Aggregate Composite MLS® Home Price Index (MLS® HPI) was up 2.3% y/y in October 2018 with similar gains posted in each of the three previous months.

Following a well-established pattern, condo apartment units posted the largest y/y price gains in October (+7.4%), followed by townhouse/row units (+3.9%). By comparison, one-storey single-family homes posted a modest increase (+0.6%) while two-storey single-family home prices held steady.

Trends continue to vary widely among the 17 housing markets tracked by the MLS® HPI. In British Columbia, home price gains have been diminishing on a y/y basis (Greater Vancouver: +1%; Fraser Valley: +6.8%; Victoria +8.5%; elsewhere on Vancouver Island: +11.8%). Vancouver’s market balance is the weakest in almost six years, and prices for both condos and single-detached homes are now falling outright (the former were previously sturdy).

By contrast, MLS® HPI benchmark price comparisons are improving on a y/y basis among housing markets in the Greater Golden Horseshoe (GGH) region of Ontario that are tracked by the index. Home prices were up from year-ago levels in Guelph (+9.3%), Hamilton-Burlington (+6.8%), the Niagara Region (+6.3%), the GTA (+2.6%) and Oakville-Milton (+2.2%). While home prices in Barrie and District remain slightly below year-ago levels (-0.9%), declines there are shrinking; if current price momentum persists, home prices in December are on track to turn positive compared to December 2017.

Across the Prairies, benchmark home prices remained below year-ago levels in Calgary (-2.6%), Edmonton (-2.4%), Regina (-3.6%) and Saskatoon (-0.9%).

Home prices rose by 6.6% y/y in Ottawa (led by a 7.4% increase in two-storey single-family home prices), by 6.3% in Greater Montreal (driven by a 9.8% increase in townhouse/row unit prices) and by 4.2% in Greater Moncton (led by a 12.4% increase in townhouse/row unit prices) (see table below).

Bottom Line

Housing markets continue to adjust to regulatory and government tightening as well as to higher mortgage rates. The speculative frenzy has cooled, and multiple bidding situations are no longer commonplace in Toronto and surrounding areas. The housing markets in the GGH appear to have bottomed. However, prices still look soggy at the higher end of the single-family home market.

The slowdown in housing markets in the Lower Mainland of BC accelerated last month as the sector continues to reverberate from provincial actions to dampen activity, as well as the broader regulatory changes and higher interest rates.

We are likely in store for a prolonged period of modest housing gains in the Greater Golden Horseshoe, stability or softening in British Columbia and further weakening in the Prairies, Albert, and Newfoundland & Labrador.

Montreal and Ottawa remain the areas of relative strength among the biggest cities. Sales dipped in both cities month-over-month in October, but they are both up a solid 11% from a year ago. In Montreal, we’ve seen some evidence that increased foreign buying activity is mixing with strong domestic fundamentals, pushing benchmark prices up 6.3% y/y. Ottawa has been boosted by a wave a federal government spending and hiring, with price growth similarly running at 6.6% y/y, though now softening from its recent high.

The Bank of Canada is expected to continue gradually tightening monetary policy. Residential mortgage credit growth has slowed to a 17-year low and, for the first time in a decade, borrowers will be refinancing 5-year fixed rate mortgages at higher interest rates.

Bank Of Canada Reports Dramatic Drop in Highly Indebted Borrowers

In a separate report, the Bank of Canada announced this week that the quality of new mortgage lending in Canada had improved markedly owing to tighter mortgage qualification rules and higher interest rates, both of which have pushed marginal buyers out of the market. This was Ottawa’s intention all along in its multiple initiatives to dampen the housing market over the past several years.

The share of new mortgages going to highly indebted borrowers–those with loan-to-income ratios of above 450%–dropped to 13% in the second quarter of this year, down from more than 18% last year. Hence, the Bank believes that there is strengthening resiliency in the financial system, aided in part by an improving economy that has prompted five rate increases since the middle of last year.

The Bank of Canada report on the mortgage market found that not only are the number of new mortgage borrowers declining, but the riskiest ones are being weeded out. The number of new uninsured borrowers considered highly-indebted fell by 39% in the second quarter from year-ago levels, with Toronto posting the most significant declines.

The Bank also commented that the tighter regulations have had one side effect–shifting market share away from the country’s six biggest banks to other institutions such as credit unions and private lenders, which they see as a potential new source of risk. The overall riskiness of new mortgages has decreased “because the proportion of risky borrowers has declined across cities,” the report found. “As well, the regional composition has shifted, with a somewhat larger share of new mortgages recently coming from areas outside Toronto and Vancouver.”

Dr. Sherry Cooper
Chief Economist, Dominion Lending Centres


Economic Highlights

CMHC issues forecast for next two years

The Canada Mortgage and Housing Corporation forecasts a balanced market in the GTA through 2020, with fewer sales expected because of rising interest rates.

“As much as sales are going to come down slightly, we’ll see house price growth be more or less in line with inflation, not the double-digit kind we were accustomed to a few months ago,” said CMHC’s Manager of Market Analysis (Toronto) Dana Senagama. “We’ll likely see higher price growth in the downtown cores of some major GTA areas, like Toronto, Markham and Mississauga, where there are higher concentrations of condominiums.”

Resales will also dip through the end of 2020, added Senagama, due to rising mortgage rates.

The region’s low-rise housing market is forecasted to see a downturn primarily because of land scarcity. However, in suburban areas, like Peel, Durham and York Regions, there will be higher concentrations of single-family detached sales and listings, and that will slow price appreciation.

“There’s not enough serviceable land out there for low-rise homes for singles and townhomes,” said Senagama. “The vast majority of units under construction—about 55,000 of 71,000 units—are high-rise, and that means there are only a finite number of resources, both in terms of machinery and skilled labour. That’s going to affect delivery; the logistics won’t allow it.

“In terms of new construction, the story is going to be more and more condos, and that seems to be where the push is both in terms of policy shift in government and higher house prices dictating demand towards high-rise construction because low-rise is out of reach for first-time buyers, and when the average price is over $1 million, it’s not an easy entry point for any buyer.”

Through this year, Vancouver has born witness to softening home prices across all market segments, and that trend is expected to continue, according to CMHC.

“Over the next two years, we expect the resale market will be characterized by lower sales, higher inventories of homes for sale, and lower home prices compared with the recent market highs in the last two years,” said Eric Bond, CMHC’s principal market analyst for Vancouver. “With the resale market,

expect housing starts to decline in the Vancouver CMA over the next two years, and the majority of the decline will be in the multi-family segment, and specifically in high-rise.”  By Neil Sharma

Mortgage Interest Rates

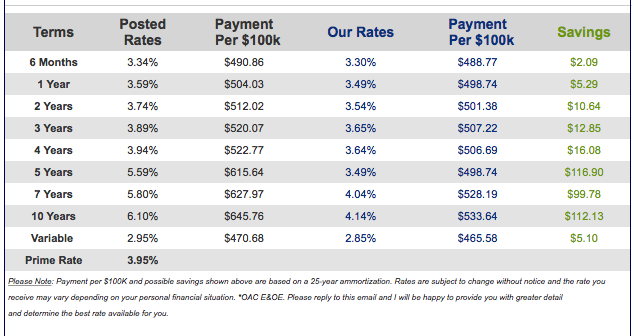
Prime lending rate increased to 3.95%.  Bank of Canada Benchmark Qualifying rate for mortgage approval remains at 5.34%.  Fixed rates are slowly increasing.  Deep discounts are offered by some lenders for variable rates making adjustable variable rate mortgages very attractive.


Terms
Posted
Rates
Payment
  Per $100k
Our Rates
Payment
  Per $100k
Savings
6 Months
3.34%
$490.86
3.30%
$488.77
$2.09
1 Year
3.59%
$504.03
3.49%
$490.86
$13.17
2 Years
3.74%
$512.02
3.54%
$496.11
$15.91
3 Years
3.89%
$520.07
3.65%
$501.38
$18.69
4 Years
3.94%
$522.77
3.64%
$506.69
$16.08
5 Years
5.59%
$615.64
3.50%
$499.27
$116.37
7 Years
5.80%
$627.97
4.04%
$528.19
$99.78
10 Years
6.10%
$645.76
4.14%
$533.64
$112.13
Variable
2.95%
$470.68
2.85%
$465.58
$5.10
Prime Rate
3.95%
Please Note: Payment per $100K and possible savings shown above are based on a 25-year ammortization. Rates are subject to change without notice and the rate you receive may vary depending on your personal financial situation. *OAC E&OE. Please reply to this email and I will be happy to provide you with greater detail and determine the best rate available for you.


Please Note: Payment per $100K and possible savings shown above are based on a 25-year ammortization. Rates are subject to change without notice and the rate you receive may vary depending on your personal financial situation. *OAC E&OE. Please reply to this email and I will be happy to provide you with greater detail and determine the best rate available for you.

This edition of the Weekly Rate Minder shows the latest rates available for Canadian mortgages. At Dominion Lending Centres, we work on your behalf to find the best possible mortgage to suit your needs.

Explore mortgage scenarios using helpful calculators on my website: http://www.iMortgageBroker.ca

Other Industry News & Insights

Roundup of the latest mortgage and housing news.

From Mortgage Professionals Canada.

Toronto rental boom drives record-breaking sales in apartments (BNN Bloomberg)

Homeowners worried about paying down debt as interest rates go up (CBC)

The average detached Vancouver house for $2.8 million? An analyst sees it happening, and maybe sooner than you think (Livabl)

Majority of first-time home buyers maxed out budgets: CMHC (BNN Bloomberg)

A rise in Canadian home listings is finally giving buyers some choice (Livabl)

First half of October brings rising home sales to the GTA: Report (Livabl)

Home search giant Zillow adds Canadian listings to online marketplace (CBC)

B.C. government moves ahead with speculation tax on vacant homes (CBC)

Canadian home prices no longer among the fastest growing in the world: Knight Frank (Livabl)

National Housing Market Flat in September, CREA Data Shows (Canadian Mortgage Trends)

85% of Canadians won’t grow pot at home as property value concerns weigh, survey finds (BNN Bloomberg)

Forget home sales — this metric foreshadows where the Canadian housing market is headed (Livabl)

52% Of Canadians Less Likely To Buy Homes Where Legal Pot Was Grown: Zoocasa Study (Huffington Post)

There is never a better time than now for a free mortgage check-up.  It makes sense to revisit your mortgage and ensure it still meets your needs and performs optimally.  Perhaps you’ve been thinking about refinancing to consolidate debt, purchasing a rental or vacation property, or simply want to know you have the best deal?  Whatever your needs, we can evaluate your situation and help you determine what’s the right and best mortgage for you.

Adriaan Driessen
Mortgage Broker
Dominion Lending Forest City Funding 10671
Cell:     519.777.9374
Fax:      519.518.1081
riebro@me.com
www.iMortgageBroker.ca
415 Wharncliffe Road South
London, ON, N6J 2M3

Lori Richards Kovac
Mortgage Agent & Administrator
Dominion Lending Forest City Funding 10671
Cell:     519.852.7116
Fax:      519.518.1081
loriakovac@icloud.com
415 Wharncliffe Road South
London, ON, N6J 2M3

Adriaan Driessen
Sales Representative & Senior Partner
PC275 Realty Brokerage
Cell:     519.777.9374
Fax:      519.518.1081
adriaan@pc275.com
www.PC275.com
415 Wharncliffe Road South
London, ON, N6J 2M3

23 Oct

Residential Market Update

Real Estate Market Update

Posted by: Adriaan Driessen

WEEKLY RESIDENTIAL  MARKET UPDATE 

pastedGraphic.png

Industry & Market Highlights 

CMHC releases Sept. housing starts data

The annual pace of Canadian housing starts fell to their lowest level in nearly two years in September.

Canada Mortgage and Housing Corp. says the seasonally adjusted annual rate came in at 188,683 units last month, down from 198,843 in August.

Thomson Reuters Eikon says economists had expected an annual rate of 210,000 for September.

September marks the third straight monthly decline.

The slowdown in the pace of housing starts comes amid rising interest rates from the Bank of Canada, and more restrictive mortgage rules.

“The September housing starts report fits with the relative calm and return to normality in sales, market balance and price growth that we are seeing across most of the country this year, in particular Toronto, following speculative excesses in Southern Ontario earlier last year and a moderate correction in response to policy measures earlier this year,” wrote Sal Guatieri, a senior economist with BMO Capital Markets, in a note.

“Demand continues to be supported by the fastest population growth in 27 years and new millennial-led households. A calmer housing market is just what the doctor ordered, and won’t discourage the Bank of Canada from raising rates on Oct. 24.”

CMHC says the pace of urban starts fell by 5.9 per cent to 175,653 units. The slowdown was dragged down by an 8.9 per cent drop to 122,656 units in urban multiple-unit projects such as condos, apartments and townhouses. Single-detached urban starts increased by two per cent to 52,997.

Rural starts were estimated at a seasonally adjusted annual rate of 13,030 units, while the six-month moving average of the monthly seasonally adjusted annual rates was 207,768 for September, down from 213,966 in August.

British Columbia led the declines with a drop of 43.3 per cent due to stiffer mortgage rules and growing lack of affordability, particularly in the Greater Vancouver area. Alberta also saw a drop of 34.8 per cent, amid a weakening in the oil-producing economies.

Meanwhile, Ontario housing starts increased 21.3 per cent, led by Toronto condos and Quebec was up 15.4 per cent.  By The Canadian Press.

First-time homebuyers are maxed out, but confident

Canadians are not holding back when it comes to buying their first home.  The annual mortgage consumer study by Canada Mortgage and Housing Corporation finds that 85% of first-time buyers are maxing-out their home-buying budgets.

The CMHC study indicates that affordability is the most important factor for both first-timers and repeat buyers, ahead of things like the condition of the home, the neighbourhood and distance to work.

More than half of recent homebuyers say other key concerns include unforeseen costs, paying too much for their property and rising interest rates.  Still, 76% of first-time buyers are confident they will be able to meet their mortgage payments.  Sixty percent of first-time buyers and 69% of repeat buyers claim to have sufficient assets, such as investments or other properties, which they could use to fund their mortgage if they needed to.

There is some support for this consumer confidence.  Recent reports by the credit monitoring firms Equifax and TransUnion indicate the growth of consumer debt (non-mortgage) is slowing and delinquency rates are declining.  At the same time the Office of the Superintendent of Financial Institutions reports the quality of mortgage loans is improving.

Rising interest rates, foreign buyer taxes and tougher mortgage qualification rules appear to be cooling real estate sales and prices across the country but the Canadian Real Estate Association is maintaining a positive forecast.

The Bank of Canada is expected to bump-up its benchmark interest rate by a quarter-point – to 1.75% – on Wednesday.  By First National Financial.

The temperature may be dropping, but Montreal is heating up

Never mind Vancouver.  Do not bother with Toronto.  Canada’s hot housing market du jour is Montreal.

While Toronto and Vancouver have been getting all the attention as the busiest, most expensive and most volatile markets in the country, Montreal has been on a sales and price appreciation roll for 43 consecutive months.

In September, Montreal home sales hit a nine year high; 3,220 units (led by 1,206 condominium transactions), up 8% compared to a year ago.  Year-over-year prices climbed 7% for single-family homes ($336,000), 6% for plexes ($504,000) and 4% for condos ($263,000).

In Vancouver, year-over-year sales declined from February through August.  In Toronto, gains have been modest.  September sales were up just 1.9% compared to 2017.  Prices were up about 2%.

High prices, rising interest rates and foreign buyer taxes appear to be weighing down the two top markets.  Montreal, meanwhile, is enjoying the benefits of good immigration, economic growth, consumer confidence and public infrastructure projects, according to the local real estate board.  By First National Financial. 


pastedGraphic.png

Economic Highlights


Interest rate rise “a done deal” but impact is showing says TD

There is little dispute among economists that the Bank of Canada will increase interest rates again this week.

Wednesday’s hike will be accompanied by explanation as to why this is necessary in the context of better-than-expected economic growth in the third quarter and core inflation is on target.

TD Economics senior economist Fotios Raptis says the hike is “a done deal” but notes in a report that the impact of rising interest rates is starting to bite.

He highlights weaker retail and consumer spending data with nominal spending declining in Saskatchewan, Quebec, Alberta, and British Columbia.

National home sales were also weaker in September and growth in home prices was weaker. TD is forecasting a slower pace of home activity in the months ahead as mortgage costs and affordability weigh.

Headline inflation, Raptis points out, was also down sharply in September with the CPI rising 2.2% year-over-year, well below the expected 2.7%.

However, with a strong business outlook, tight labour market, and rising wages, he believes that the BoC has reason to believe the economy can withstand another rate rise.

Rate rises will remain gradual

Meanwhile, CIBC Economics’ Avery Shenfeld says the BoC will remain cautious on rate rises following this week’s near-certain hike.

Apart from the NAFTA-replacement USMCA trade deal, not much has changed since the central bank last spoke of gradual rate rises.

Although Shenfeld expects Governor Poloz to avoid too much forward guidance although there should be positive talk regarding growth in 2018 and 2019.  By Steve Randall.

Did the new USMCA effect rates?

It’s been rough week for bonds. Since we closed the books last Friday, 2 year yields are up 10 basis points to 2.31%, 5 year yields are up 15 basis points to 2.48%, and 10 year yields are up 16 basis points to 2.58%.

Of course the question isn’t where rates are, but rather WHY are rates here?  The most obvious answer was Canada’s agreement to join the US-Mexico trade agreement (now the “USMCA”) last weekend.  Canada made some key concessions on dairy but the US agreed to protect Canada from potential tariffs on autos.  The reduction of uncertainty and de-escalation of a possible trade war was bullish for Canadian economic growth expectations and rates move higher.  The initial down trade (prices) was highlighted by momentum/negative gamma type selling (or put another way, more sellers than buyers).  Easy peasy.

The selling is presently being punctuated by a stronger than expected jobs report this morning.  Canadian employment popped by 63,300 jobs in September, more than reversing the drop reported last month.  The unemployment rate dropped a tick to 5.9%.  We also can’t underestimate the impact of the new NHL season kicking off with a potentially historic run in the cards for the Leafs.  With the removal of trade overhang (and two goals by Auston Matthews in the season opener) the market has now priced in two 25 basis point hikes by the BoC by January.

Commercial Break

We’ll pause here to highlight First National’s excellent early rate lock program for all your commercial mortgage borrowing needs.  If you’ve already hedged your fixed rate borrowing, congratulations.  If you haven’t, it’s not too late.  Help me help you.  Call your favourite First National underwriter, lock-in, and sleep better!  Two sure things in life are the benefits of sunscreen and hedging your fixed rate mortgages.  By Jason Ellis, Senior Vice President and Managing Director, Capital Markets, First National Financial.

pastedGraphic_1.png

Mortgage Interest Rates

Prime lending rate is 3.7%.  Bank of Canada Benchmark Qualifying rate for mortgage approval is at 5.34%.  Fixed rate increased across the board on average 25 basis points.  Deep discounts are offered by some lenders for variable rates making adjustable variable rate mortgages very attractive.

pastedGraphic_2.png
Terms Posted

Rates

Payment

  Per $100k

Our Rates Payment

  Per $100k

Savings
6 Months 3.14% $480.46 3.10% $478.39 $2.07
1 Year 3.34% $490.86 3.29% $488.25 $2.61
2 Years 3.74% $512.02 3.44% $496.11 $15.91
3 Years 3.89% $520.07 3.54% $501.38 $18.69
4 Years 3.94% $522.77 3.64% $506.69 $16.08
5 Years 5.59% $615.64 3.54% $493.48 $122.16
7 Years 5.80% $627.97 4.04% $528.19 $99.78
10 Years 6.10% $645.76 4.14% $533.64 $112.13
Variable 2.70% $457.99 2.70% $457.99 $0.00
Prime Rate 3.70%
Please Note: Payment per $100K and possible savings shown above are based on a 25-year ammortization. Rates are subject to change without notice and the rate you receive may vary depending on your personal financial situation. *OAC E&OE. Please reply to this email and I will be happy to provide you with greater detail and determine the best rate available for you.
This edition of the Weekly Rate Minder shows the latest rates available for Canadian mortgages. At Dominion Lending Centres, we work on your behalf to find the best possible mortgage to suit your needs.

Explore mortgage scenarios using helpful calculators on my website: http://www.iMortgageBroker.ca


5 Oct

Residential Market Update

Real Estate Market Update

Posted by: Adriaan Driessen

WEEKLY RESIDENTIAL  MARKET UPDATE 

pastedGraphic.png

Industry & Market Highlights 

The short break in interest rate increases may be over

Over the past few months rates have held steady and gave home owners a reprieve in the increasing mortgage interest rate market.  After the official announcement of a trilateral trade agreement with Canada, the U.S. and Mexico, and the US Federal Reserve Bank raising interest Rates – most Economists agree that the Bank of Canada is next to make a rate announcement, and we may start to see some slow, but steady interest rate increases again. Of course no one can say for sure, but the signs seem to point in that direction. If you’re feeling nervous about rates increasing contact your broker to review your options to look out for your best interest.

If you are currently in a variable rate mortgage with a lower risk tolerance, this may be the time to consider locking in.  If you have a high risk tolerance and are used to the ebb and flow of markets, it’s business as usual. 

Increases in the U.S. and the potential ripple effect

Market watchers who are forecasting another Bank of Canada rate increase next month have been handed more backing for their prediction.

Last week the U.S. Federal Reserve pushed up its policy rate for the eighth time since December of 2015.  The Fed increased its benchmark rate by 25 basis points (a quarter of a percent) to a range of 2% to 2.25%, the same level it was at in April 2008, before the height of the global financial crisis.  The U.S. central bank also made it clear it intends to continue along that path.

The Fed says it expects one more increase this year and is projecting at least three hikes in 2019.  It has also changed some of the language in the accompanying statement, eliminating the phrase “the stance of monetary policy remains accommodative.”

The effects of U.S. rate increases routinely ripple across the border influencing bond rates and the value of the Canadian dollar.  A declining loonie could trigger further inflation, as the cost of imported goods increase.

The Bank of Canada is already facing an inflation rate that is running on the high side of its 1% to 3% target range.  Unemployment is at generationally low levels in Canada, and working people exercising their spending power can also fuel inflation.

Given these pressures and the BoC’s stated desire to normalize interest rates another quarter-point increase seems very likely on October 24th.  By First National Financial.

SOLD Date Coming to Realtor.ca

CREA’s Board of Directors has voted to add sold and historical data to the property listings on Realtor.ca without the need for a login.

In a message to real estate boards across the country, CREA says the move comes “in order to meet consumer demand and at the request of Realtors and boards.”

It says, “In addition to responding to requests from members, this will ensure we continue to offer leading edge services on the best real estate website in Canada.”

A Competition Tribunal decision in July 2016 found that by not including sold and other data in its VOW feed to members, TREB had engaged in anti-competitive acts. An appeal court upheld the decision and on Aug. 23 of this year, the Supreme Court of Canada announced that it would not hear TREB’s appeal. CREA supported TREB at the tribunal and had intervenor status in the proceedings.

TREB is now supplying the disputed data to its member VOWs.

CREA media relations officer Pierre Leduc says that before the sold data can be displayed on Realtor.ca, each real estate board must request that the information be added. CREA will then work with the boards, the provincial associations and the regulators to ensure that it complies with all laws and regulations.

“We’ll have to check with the boards to see what historic sold data they have access to, and how far back that data will go,” says Leduc.

Only historic sold prices will be posted and not pending solds, he says. Pending solds were part of the Competition Tribunal order for VOWs, but consumers and Realtors are concerned about privacy issues on deals that have yet to close.

Leduc says CREA hopes to have the sold data rolled out on Realtor.ca as soon as possible.  By REMonline.com

CREA: National home sales post modest sales gain

Growth in Canada’s housing market in August was modest as the effects of the mortgage stress test continues, although is beginning to fade.

The latest sales data and forecast from the Canadian Real Estate Association released Monday shows a small rise for sales in August, a 0.9% increase month-over-month.

Actual (not seasonally-adjusted) activity was down 3.8% year-over-year while prices nationally increased 1% from a year earlier. Sales activity is weaker than most months over the last 4 years.

“The new stress-test on mortgage applicants implemented earlier this year continues to weigh on national home sales,” said CREA President Barb Sukkau. “The degree to which the stress-test continues to sideline home buyers varies depending on location, housing type and price range.”

There were 5.2 months of inventory on a national basis at the end of August 2018, right in line with the long-term average for the measure.

The Aggregate Composite MLS® Home Price Index (MLS® HPI) was up 2.5% y-o-y in August 2018.

The largest y-o-y price gains in August were for apartments (+9.5%), followed by townhouse/row units (+4.3%). But prices for one-storey and two-storey single family homes were little changed on a y-o-y basis in August (+0.4% and -0.4% respectively).

Where the gains were

Around half of all local markets recorded an increase in sales from July to August, led again by the GTA.

TD Economics’ analysis of the data shows the largest gains were in Toronto (+2.2%), Montreal (+2.8%) and Edmonton (+5.4%) while sales were lower in Halifax (-8.2%), London (-1.2%) and Winnipeg (-1.0%).

Activity picked up in several markets in B.C. including 2.9% in Vancouver – the first gain this year – along with the Fraser Valley (+0.6%), Okanagan-Mainline (+1.7%), and Victoria (+2.7%).

“Our view is that sales and prices will continue to grow, but that rising borrowing costs will restrain the pace of expansion. This is particularly true for more expensive markets in Ontario and B.C. where affordability pressures are acute,” TD economist Rishi Sondhi says.

Activity had fallen too far

In his assessment of the CREA data, RBC Economics’ senior economist Robert Hogue says that the figures show that the recent drop in activity was part of the market finding its normal level following B-20.

“The fact that home resales snapped back by 8.1% in the four months since reaching a seven-year low in April tells us that activity had fallen too far. This is typical following a major policy change that pulled some activity forward,” he said.

He added that the latest figures reflect a new, slower phase of recovery.  By Steve Randall.

Decreasing certainty for an increase in rates

Market watchers have now fixed their gaze on October 24th as the most likely date for the next rate move by the Bank of Canada.  As of the setting last week, that saw no change, the betting was about 75% in favour of a hike in October, but that certainty seems to be slipping.

The latest employment numbers from Statistics Canada will likely have the Bank carefully considering any move toward an increase.  The August unemployment rate popped-up 0.2 of a percentage point to 6.0%, on a net loss of 51,600 jobs in August.

The August jobs report is sending mixed messages though.  Most of the losses came in part-time positions, which fell by 92,000.  Full-time jobs actually increased by 40,400.  Year-over-year employment in Canada is up 0.9%.  While 155,000 part-time positions have disappeared, there has been a gain of 326,000 full-time jobs for a net gain of 171,000 positions.

Another factor that could hold back an October rate increase is a softening of wage growth.  The rate of increase in hourly pay slowed to 2.9% in August, down from 3.2% – year-over-year – in July and a 3.6% in June.

The bigger issue, though, remains the NAFTA re-negotiations.  Uncertainty about the outcome of the talks is a drag on the Canadian economy.  It is hampering the Bank of Canada’s efforts to move economic growth away from debt-fueled consumer spending to business investment and export growth.

The Bank continues to use words like cautious and gradual to describe its approach and with inflation remaining well inside the Bank’s target range there is no urgency for a rate increase.  By First National Financial. 

Canadian Mortgage Credit Growth Grinds To A Halt, Worst Growth In 18 Years

The Canadian real estate market is slowing down, and it’s hitting mortgages. Bank of Canada (BoC) numbers show mortgage credit grinded to a halt in July. The annual rate of mortgage growth fell to the lowest level in nearly 18 years, and is set up to go lower.

Canadians Owe Over $1.52 Trillion In Mortgage Debt

Canadians set a new dollar record for outstanding mortgage credit at institutional lenders. The outstanding balance stood at $1.52 trillion in July, up $4.95 billion from the month before. Households sent the total $54.22 billion higher than the same time last year. On the upside, lenders are primed to receive a whole lot of interest payments. On the other  hand, if we look closely – we see the rate of growth is actually shrinking very quickly.

Canadian Mortgage Credit Falls To Lowest Growth Since July 2001

The growth of mortgage credit fell to its lowest levels in almost two decades. The $54.22 billion increase from last year comes in at just 3.7% growth. That still sounds pretty decent, until you realize it’s only 0.68% in real terms. The annual pace of growth is now the lowest it’s been since July 2001. For historical context, a then new artist named Shaggy topped the charts with It Wasn’t Me when mortgage growth was last this low. Of course most of you have no idea who he is, so ask your mom for the best explanation. Then tell her mortgage levels fell to Shaggy-era levels of growth, and email us her take.

Mortgage Growth Likely To Head Lower

Looking at the short-term trend, these numbers will likely come in lower for at least a few more months. Annualizing growth over the past 3 months, we get just 1.7% – lower than inflation. This means if the annual growth rate came in at the same pace as the past 3 months, the rate would fall to 1.7%. Until this number rises above the annual pace for a while, expect the rate to continue to fall.

Canada is coming off of record sales years, and interest rates are quickly climbing. That’s dropping demand for new loans, and tightening credit requirements. It shouldn’t be a huge surprise that mortgage growth is on the decline, and likely to slide further.  By betterdwelling.com

Reviewing the Stress Test and B-20 Lending rules hindering the Canadian Housing Market

Back in 2013, the B-20 rules as underwriting guidelines for residential mortgages came into effect. The rules were put in place as a direct response to the financial issues in the United States caused by “poor mortgage lending practices” (mortgagebrokernews.ca).

Now, 5 years after these rules have come into effect, Canada’s housing market is said to be facing affordability issues. It is widely believed that it is become increasingly more difficult for first time home buyers to purchase a property. To deal with the affordability issues and the stress test, some young people are borrowing from parents to help with a down payment.

Recently, it has been reported that there is a decrease in mortgage originations from the Millennial and Generation Z cohort and a rise amongst the Pre-War Generation (those between the ages of 73-93). Findings have shown an increase of mortgage originations of 63% in the last quarter from the Pre-War Generation (theglobeandmail.com).

This begs the questions: are those who are trying to get into the housing market seeking help from their grandparents and asking them to take out mortgages for their grandchildren? Is the current generation asking and receiving help from their aging grandparents? If so, what else are they willing to do to achieve their goal of home ownership

The Conservative party as made a motion to the House of Commons to institute a subcommittee to review the stress test and B-20 rules to determine if it is helping or hindering the Canadian housing market.  By CMBA, Canadian Mortgage Brokers Association.


pastedGraphic.png

Economic Highlights


Canadian Jobs Plunge in August As Unemployment Rises

In a real shocker, Statistics Canada announced this morning that employment dropped by 51,600, retracing most of the 54,100 gain in July. Economists had been expecting a much stronger number, but the Labour Force Survey is notoriously volatile, and job gains continue to average 14,000 per month over the past year. Full-time employment growth has run at about twice the pace at an average monthly increase of 27,000. Labour markets remain very tight across the country.

The unemployment rate returned to its June level of 6.0%, ticking up from 5.8% in July. July’s jobless figure matched a more than four-decade klow. At 6.0%, the unemployment rate is 0.2 percentage points below the level one year ago.

All of the job loss last month was in part-time work, down 92,000, while full-time employment rose by 40,400. The strength in full-time jobs is a sign that the labour market is stronger than the headline numbers for August suggest.

On a year-over-year basis, employment grew by 172,000 or 0.9%. Full-time employment increased (+326,000 or +2.2%), while the number of people working part-time declined (-154,000 or -4.3%). Over the same period, total hours worked were up 1.6%.

Statistics Canada commented that monthly shifts in part-time employment could result from movements between part-time and full-time work, the flux of younger and older workers in and out of the labour force, changes in employment in industries where part-time work is relatively common, or deviations from typical seasonal patterns.

By industry, the decline was broadly based and included a loss of 16,400 jobs in construction and 22,100 in the professional services sector. The number of people working in wholesale and retail trade declined by 20,000, driven by Quebec and Ontario.

Job losses were huge in Ontario as employment increased in Alberta and Manitoba. Employment was little changed in the other provinces.

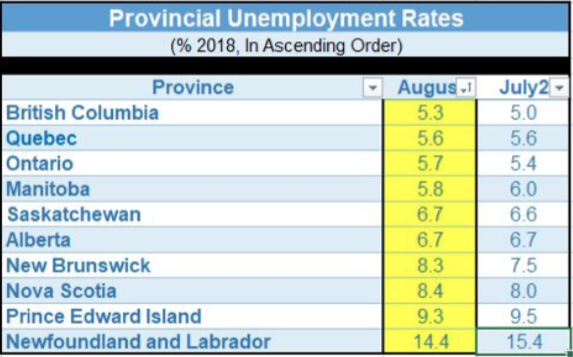
After two consecutive monthly increases, employment in Ontario fell by 80,000 in August, which was the province’s most significant job loss since 2009. All of the decline was in part-time work. On a year-over-year basis, Ontario employment increased by 79,000 (+1.1%). The Ontario unemployment rate rose 0.3 percentage points in August, to 5.7% (see table below).

In Ontario, full-time employment held steady compared with the previous month, with year-over-year gains totalling 172,000 (+3.0%). Part-time jobs fell by 80,000 in August, following a roughly equivalent rise in July. In the 12 months to August, part-time work decreased by 93,000 (-6.7%).

Employment in Alberta rose by 16,000, and the unemployment rate remained at 6.7% as more people participated in the labour market. Compared with August 2017, employment grew by 53,000 (+2.3%), mostly in full-time work.

In Manitoba, employment rose by 2,600, driven by gains in part-time work, and the unemployment rate was 5.8%. On a year-over-year basis, employment in the province was unchanged, while the unemployment rate increased 0.8 percentage points as more people looked for work.

In British Columbia, employment edged up and the unemployment rate increased 0.3 percentage points to 5.3% as more people searched for work. Compared with a year earlier, employment was virtually unchanged.

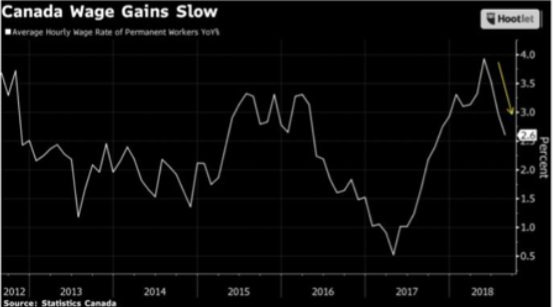
Wage gains decelerated to their lowest level this year as average hourly earnings were up 2.9% y/y, the slowest pace since December.

There is no real urgency for the Bank of Canada to hike interest rates as the economy shows little risk of overheating. So far in 2018, the economy has shed 14,600 jobs, but the number masks a 97,300 gain in full-time work. Part-time employment is down by 111,900 this year.

The economy is running at or near full-employment as job vacancies continue to mount. If a NAFTA agreement comes to fruition, it is still likely the Bank of Canada will raise interest rates once again at the policy meeting in October. The Bank of Canada guided in that direction yesterday when Senior Deputy Governor Carolyn Wilkins said the central bank’s top officials debated this week whether to accelerate the pace of potential interest rate hikes, before finally choosing to stick to their current “gradual” path.  
pastedGraphic_1.png

pastedGraphic_2.png

By Dr. Sherry Cooper

Chief Economist, Dominion Lending Centres.

17 Sep

WEEKLY RESIDENTIAL MARKET UPDATE

Real Estate Market Update

Posted by: Adriaan Driessen

pastedGraphic.png

Industry & Market Highlights 
Poloz Holds The Line On Rates
As expected, the Bank of Canada held its key overnight rate this morning at 1.5%, asserting that July’s surprising spike in CPI inflation to 3% was in large part because of a jump in airfares. The Bank expects inflation to move back towards 2% in early 2019, as the effects of past increases in gasoline prices dissipate. The Bank’s core measures of inflation remain firmly around 2%, consistent with an economy that has been bumping up against full capacity for some time. Wage growth, as well, remains moderate.
Incoming information on the global economy is consistent with the Bank’s forecast in the July Monetary Policy Report (MPR). The U.S. economy has been particularly strong, growing at a 4.2% rate in the second quarter. This compares to Canada’s growth rate of 2.9% last quarter, which follows a 1.4% pace of economic expansion in Q1. Second quarter growth in the U.S. was boosted by strong consumer spending and business investment. In Canada, third quarter growth is expected to slow temporarily, mainly because of fluctuations in energy production and exports.
Indeed, this morning, Statistics Canada reported that Canada’s trade deficit all but disappeared. A sharp export gain to the U.S. combined with a decline in imports took Canada’s overall merchandise trade deficit to its lowest level since December 2016.
Canada’s merchandise trade surplus with the U.S., targeted by President Donald Trump in NAFTA negotiations, grew to the widest in a decade. Stats Canada said that gains in global exports were led by automobiles and energy, almost all of which were bound for the U.S. Crude oil led the energy gains as prices rose 9.4% in July. The import decline was driven by aircraft and metal ores.
These figures are likely to impact the resumption of bilateral talks in Washington regarding NAFTA, as the Trump administration has negotiated a new deal with Mexico and has threatened to leave Canada out and impose stiff auto tariffs if Prime Minister Justin Trudeau’s government does not make concessions, especially on dairy supply management and dispute mechanisms.
The Bank of Canada highlighted that “elevated trade tensions remain a key risk to the global outlook and are pulling some commodity prices lower…The Bank is also monitoring the course of NAFTA negotiations and other trade policy development closely, and their impact on the inflation outlook.”
It was wise of the Bank of Canada to hold its powder dry at today’s policy meeting given the continued uncertainty on the NAFTA front. An agreement on NAFTA would provide the central bank with more comfort in moving ahead with a hiking cycle that has already lifted the benchmark overnight rate four times since mid-2017.
Noting that “activity in the housing market is beginning to stabilize as households adjust to higher interest rates and changes in housing policies”, the Bank reaffirmed that the economy is doing well enough to require higher interest rates in the future to achieve the inflation target. Another rate hike could come as soon as the next policy meeting on October 24th.
It is widely expected that a NAFTA deal will have come to fruition by then, opening the way for the Bank to resume monetary tightening. According to Bloomberg News, “Investors see near-certain odds that by October, the Bank of Canada will raise borrowing costs for the fifth time since the hiking cycle began in July 2017, with as many as two additional increases by mid-2019.”  By Dr. Sherry Cooper
Chief Economist, Dominion Lending Centres.
The key reason for the decline of new mortgage loans
A new report from Canada Mortgage and Housing Corporation confirms what we have all suspected: there were fewer mortgages taken out in 2017 compared to 2016.  The key reason for the decline suggests 2018 will see more of the same.
Using data from credit monitoring agency Equifax, CMHC reports just shy of 960,000 new mortgage loans in 2017, down 6.5% from 2016.
Of the five categories of borrowers examined, the biggest decline in new mortgages was a 17.5% drop among homeowners who renewed with a new lender.  This suggests: homeowners may not be shopping around for renewals the way they do for their initial mortgage; lenders are offering attractive terms to retain clients; the terms and conditions for moving to a new lender are too onerous.
The only category to see an increase in new mortgages was multiple mortgage holders which rose to 15.1% from 13.6% in 2016.  An analysis of CMHC figures by the real estate website Better Dwelling suggests more than 15% of new mortgages were taken out on properties that have an existing mortgage, up nearly 5% from 2016.
CMHC cites the 2016 rule changes for high-ratio mortgages as the key reason for the decline.  All mortgages with a down payment of less than 20% would have had to qualify at the greater of their contract mortgage rate or the Bank of Canada’s conventional five-year fixed posted rate.
Given the 2018 rule changes that imposed a similar stress test on all mortgages, and the rising interest rate environment, it stands to reason there will be further declines this year.  By First National Financial.
 LSTAR’s News Release for August 2018, solid home sales in august cap a strong summer season
London and St Thomas Association of REALTORS® (LSTAR) announced 923 homes* were sold in August, up 2.2% over the same time last year. August 2018 marked the second best August for home resales since the Association began tracking sales data in 1978. August 2016 holds the record, with 999 home resales.
“It was a very strong summer for home resales, with August achieving very solid numbers,” said Jeff Nethercott, 2018 LSTAR President. “Resale activity has performed high above the 10-year average, despite low inventory, which the marketplace has experienced all year. The average sales price continues to rise: it was $378,511, up 18.0% from August 2017. When you go back five years, that’s up 54.2% compared to August 2013.”
Breaking it down by geography, London South (which also includes data from the west side of the city) had an average sales price of $381,636, up 17.5% from August 2017 and up 55.8% from August 2013. London East continues to experience a steady gain in average sales price, coming in at $287,162, up 16.6% from August 2017 and up 38.9% from August 2013. Meanwhile in London North, the average sales price was $466,654, up 11.9% from August 2017 and up 57.3% from August 2013.
“Average home sales price may be up across the region, but we continue to experience a 10-year historical low in inventory,” Nethercott said. “In August, there were 1,535 active listings, down 12.6% from this time last year and down 57.6% from August 2013. The sales-to-new listings ratio was 85.1%, which the Canadian Real Estate Association (CREA) says represents conditions in the marketplace that favour sellers (a ratio between 40% and 60% is generally consistent with a balanced market). Going back to August 2013, the sales-to-new listings ratio for the region was 54.5%. In August, London North had a sales-to-new listings ratio of 92.1%, while in London South it was 90.8%.”
St. Thomas saw a total of 66 homes sold in August, up 11.9% from the same period last year. For inventory, there were 98 active listings, down 10.9% from last August and down 59.8% from August 2013. The average home sales price in St. Thomas was $295,262 up 17.2% from August 2017 and up 46.9% from August 2013.
The following chart is based on data taken from the CREA National MLS® Report for July 2018 (the latest CREA statistics available). It provides a snapshot of how average home prices in London and St. Thomas compare to other major Ontario and Canadian centres.

unknown.png

Supreme Court hands down ruling in TREB v Competition Bureau
The Supreme Court of Canada has refused to hear an appeal from the Toronto Real Estate Board that would have prevented the numbers from being posted on password-protected webpages.
Greater Toronto Area realtors can now publish home sales data on their websites after the top court ruled against the real estate board, a case that could have sweeping implications for consumer access to real estate data across the country.
TREB’s appeal stems from a seven-year court battle that began in 2011 when the Competition Bureau challenged its policy preventing the publication of such information, arguing it impedes competition and digital innovation.
Canada’s largest real estate board, which represents more than 50,000 Ontario agents, argued at the Competition Tribunal and later the Federal Court of Appeal that posting the data would violate consumer privacy and copyright.
Both judicial bodies sided with the bureau, prompting TREB to take the fight to the Supreme Court of Canada.
Since the court won’t hear the case, lawyers say there is likely nothing TREB can to do to keep its legal battle going and the data from being posted.  By The Canadian Press.
22 Aug

WEEKLY RESIDENTIAL MARKET UPDATE

Real Estate Market Update

Posted by: Adriaan Driessen

pastedGraphic.png
Industry & Market Highlights 
Market improvements as expected
Improvements in the housing market that were forecast for the second half of this year appear to be materializing.
The July numbers from the Canadian Real Estate Association show a sales increase of 1.9% in July over June.  June was up more than 4% from May.  Year-over-year, however, July sales were off 1.3%, pulled down by fewer sales in major urban centres in British Columbia.  The decline in B.C. was offset by increases in the Greater Toronto Area, which saw an 18.6% jump from a year ago.
Home prices were down compared to June, but up modestly from a year ago.  The MLS Home Price Index recorded a 2.1% increase while the national average price was up by 1%.  Condominium apartments and townhouses led the way with increases of 10.1% and 4.7% respectively.  One and two-storey single family homes saw price declines of 0.7% and 1.5% respectively.
The average price for a home in Canada stands at $481,500.  With Toronto and Vancouver taken out, the average drops to $383,000.
In the GTA home prices dipped 0.6%.  In B.C. price increases slowed but still posted remarkable gains well into the double digits in some areas. (GVA: +6.7%; Fraser Valley: +13.8%; Victoria: 8.2%; elsewhere on Vancouver Island: +13.7%)
Calgary and Edmonton recorded small year-over-year declines of 1.7% and 1.3%.  Montreal posted a moderate increase of 5.7%.
The number of new listings was down by 1.2% putting the sales-to-new listings ratio at 55.9%.  The ratio’s long-term average is 53.4%.  By First National Financial.
Stats indicate adjustment to B-20
Real estate sales in Canada are trending upward and it’s likely an indication that consumers have come to grips with B-20.
Canadian Real Estate Association sales statistics for July show  national home sales rose 1.9% over the previous month—and according to REMAX’s regional executive vice president, that means buyers have finally adjusted to stricter qualification rules.
“It certainly looks like consumers are slowly becoming accustomed to the B-20 mortgage qualification guidelines,” said Elton Ash. “It’s occurring a little later than we thought, and that seems to be the reason why inventory levels are dropping in the Toronto area.”
While a tough pill to swallow for many, Canadians are realizing that in order to become homeowners, they’ll have to settle for less house.
“What’s occurring is they’re readjusting their expectations,” he said. “In other words, where they may have qualified previously to purchase an $850,000 home, they’re now looking at a $750,000 home. It’s not that they’re seeking secondary financing—because the only lenders not bound by B-20 are credit unions and private lenders—it’s reducing their overall expectations of what they can afford in the type of home they’re looking for.”
The real estate market, it would appear, has finally balanced, and Ash expects that to last through the first quarter of 2019. He added that last year’s record sales volume and price increases were an anomaly that people should be cognizant about before making drawing comparisons.
“When you measure against a record-setting year on a year-over-year basis, what appears to be negative is actually positive,” said Ash. “The whole B-20 mortgage qualification stress test was brought in to slow the market, and that is certainly what’s occurring, and what we’re getting into is more traditional market situation where it’s balanced overall. The days on market for homes are stretching out to what they were, and multiple offer situations have disappeared across the board, although in Toronto proper they occur in certain situations.”  By Neil Sharma.
CMHC introduces enhancements that provide flexibility for self-employed borrowers effective Oct. 1, 2018
I’m sure you’ve heard by now the CMHC has made some changes to how self-employed Canadians can access financing. The CMHC have kindly provided some details on the new guidelines: 
Approximately 15% of Canadians are self-employed and may have difficulty accessing financing to buy a home, since their income sources may vary or be less predictable than employed borrowers. In line with the National Housing Strategy commitment to address the housing needs of Canadians along the housing continuum, CMHC is pleased to introduce enhancements that provide increased flexibility for satisfying income and employment requirements for self-employed borrowers.
 
The following table outlines enhancements to CMHC’s guidelines, which apply to transactional and portfolio insurance (1-4 unit residential properties):  Review it HERE.
The noted enhancements to CMHC’s guidelines for satisfying income and employment requirements for self-employed borrowers will become effective on October 1, 2018.
Please note that the establishment of these CMHC guidelines does not preclude Approved Lenders from observing their own lending practices.  As such, implementation of CMHC guidelines may vary among lenders.  By Dave Teixeira, Dominion Lending Centres.
pastedGraphic_1.png
Economic Highlights


Canadian Data Release: Existing home sales rose for 3rd straight month in July
·       Existing home sales rose 1.9% month-on-month in July, marking the third straight monthly gain. However, sales were downwardly revised in June to show 3.4% growth (previously 4.1%). More than half of all local markets reported increased activity in July, led by a solid 7.7% gain in the GTA. Sales also rose in Saskatoon (+12.3%), Ottawa (+1.4%), London (+2.5%), Hamilton-Burlington (+2.3%), Fraser Valley (+5.6%) and Victoria (+1.5%). Conversely, activity was lower in Calgary (-3.5%) and Winnipeg (-3.2%) while being flat in the GVA.
·       New listings dropped by 1.2% in July, weighed on by declines in Calgary (-8.0%), Edmonton (-7.2%) and the GVA (-4.4%). Meanwhile, listings advanced 5.1% in the GTA.
·       With new listings dropping and sales rising, the sales-to-new listings ratio increased to 55.9 in July – still reflective of balanced market conditions though inching closer to seller’s territory. Provincially, the ratio was highest in New Brunswick (71.3), PEI (66.7) and Quebec (62.4). Conversely, the ratio was lowest in Saskatchewan (39.2), Alberta (45.6) and Newfoundland and Labrador (33.0) – indicating loose conditions in these markets. In Ontario, the ratio increased to 59.7, its highest level since January.  The ratio also increased to 52.3 in B.C., though it still sits below its 10-year average.
·       The average home price rose for the fourth straight month in July (+1.0%) and was flat on a year-over-year basis – an improvement compared to the 1.3% year-over-year drop recorded in June. 
·       The quality-adjusted MLS home price index was up 2.1% from a year-ago – also an improvement versus June’s 0.9% gain. Quality-adjusted prices were higher in most markets, with exception of the Prairies. Price growth was robust in Ottawa (7.2% y/y) and Montreal (5.7%). Prices were slightly lower in the GTA (-0.6% y/y), though this was a notable improvement from June (-4.8% y/y). In the GVA, price growth decelerated to its softest pace since 2014 (6.7% y/y).
Key Implications
·       July’s was a good month for housing markets, as sales increased for the third straight month alongside another rise in prices. This lends further credence to our view that markets have shaken off the bout of policy-induced weakness in the earlier part of the year.
·       Since April, sales have increased in 7 of 10 Provinces, with sharp gains in Ontario and New Brunswick. However, activity remains notably weak in B.C., where markets are being impacted by provincial policy measures in addition to the revised B-20 underwriting guidelines and rising borrowing costs. The imposition of a new housing speculation tax should place additional downward pressure on markets in B.C. in coming months.     
·       We expect Canadian resale activity to improve at a gradual pace going forward, buoyed by a decent economic backdrop and solid population growth, though some restraint should come from rising borrowing costs. This should help residential investment add to overall growth in the second half of the year.   By Rishi Sondhi, TD Economist.
United States
·        Concerns about Turkey drove market volatility this week, but U.S. equity markets managed a rebound.
·        Strong retail sales and historically-high small business optimism suggest a strong economic expansion in the U.S. this quarter.
·        Although concerns eased by week’s end, Turkey is not out of the woods yet. It remains in the early stages of a balance of payments crisis, and is likely to trigger further bouts of market volatility.
Canada
·        Canadian economic data continued to impress this week. A solid resale housing report, respectable manufacturing numbers and surprisingly strong inflation all paint a picture of a healthy economy.
·        Of particular note, home sales rose for a third straight month, as did average sale prices. Evidence continues to mount that, as expected, the impact of cooling measures early in the year have been short-lived, even if there remains lots of lost ground left for sales to make up.
·        Economic risks remain very real, but continued solid out-turns suggest that the next policy interest rate hike is not that far off.
By TD Economics.  Read the full report Here.
pastedGraphic_2.png
Mortgage Interest Rates
Prime lending rate is 3.7%.  Bank of Canada Benchmark Qualifying rate for mortgage approval is at 5.34%.  Fixed rates are holding steady, no change in fixed rates.  Deep discounts are offered by some lenders for variable rates making adjustable variable rate mortgages very attractive.
pastedGraphic_3.png
Terms
Posted
Rates
Payment
  Per $100k
Our Rates
Payment
  Per $100k
Savings
6 Months
3.14%
$480.46
3.10%
$478.39
$2.07
1 Year
3.04%
$475.30
2.99%
$472.73
$2.57
2 Years
3.44%
$496.11
3.24%
$485.65
$10.46
3 Years
3.59%
$504.03
3.39%
$493.48
$10.55
4 Years
3.89%
$520.07
3.54%
$501.38
$18.69
5 Years
5.59%
$615.64
3.29%
$488.25
$127.39
7 Years
5.80%
$627.97
3.94%
$522.77
$105.19
10 Years
6.10%
$645.76
3.99%
$525.48
$120.28
Variable
2.70%
$457.99
2.41%
$443.50
$14.49
Prime Rate
3.70%
Please Note: Payment per $100K and possible savings shown above are based on a 25-year ammortization. Rates are subject to change without notice and the rate you receive may vary depending on your personal financial situation. *OAC E&OE. Please reply to this email and I will be happy to provide you with greater detail and determine the best rate available for you.
This edition of the Weekly Rate Minder shows the latest rates available for Canadian mortgages. At Dominion Lending Centres, we work on your behalf to find the best possible mortgage to suit your needs.
Explore mortgage scenarios using helpful calculators on my website: http://www.iMortgageBroker.ca
pastedGraphic_4.png
Other Industry News & Insights
Why were so many borrowers renewing with the same lender last year?
According to a Canada Mortgage and Housing Corporation analysis, mortgage renewals with different lenders in Toronto declined dramatically in 2017 compared to the year before.
Tania Bourassa-Ochoa, a senior economic researcher with CMHC, theorizes that the 25.7% decline can be attributed to the B-20 rule changes in 2016.
“One of the reasons that could partially explain this is the mortgage rule changes in 2016,” Bourassa-Ochoa told MortgageBrokerNews.ca. “There was the stress test mortgages had to go through, but the problem is we’re not able to confirm this because we’re unable to observe the number of renewals with the same lenders. It’s hard to know if it’s really because of that.
“When you look at all of the major markets and you see the two most expensive markets in Toronto and Vancouver, that’s where the largest declines of renewals with different lenders was observed.”
While it is difficult to discount the role stress testing mortgages play in cooling activity—as well as the fact that lenders aren’t competitive with renewal rates to begin with—there could be another explanation for why so many borrowers decided to remain with their lenders.
“Historically speaking, lenders aren’t that competitive on renewal, especially if you look at 2016 to 2017 when they would come out with a subpar rate at best,” said Benjamin Sammut, a Mortgage Architectsbroker. “The only thing I can think of is they’re upping their game and starting to be a little more competitive in what they’re offering in terms of rate, and they’re probably contacting their clients a little earlier. What used to be 90 days out has turned into a 180 days out. We’ve even heard of instances where clients are being told a year in advance that they could do an early renewal.”
The decline in renewals with different lenders is confounding, though, because lenders don’t incent borrowers to stay with them.
“If they’re incentivized somewhere else and they can get the exact same product somewhere else, then they’re usually more inclined to do that,” said Sammut. “It’s like looking at Bell and Rogers: They’re the exact same product, but it’s a question of who’s going to screw you less.”
The CMHC analysis of Equifax data also determined that refinances declined in 2017 compared with a year earlier, and it’s likely because fewer homeowners were willing to leverage their properties, which is consistent with the decelerated price growth in some of the country’s major markets at the time.
“The only explanation I can think of is you have borrowers seeing a stricter environment,” said Bourassa-Ochoa. “People wanted to see what would happen because of the threat of rate increases and stricter and stricter regulation. They probably just wanted to hold off, and that included refinances for debt consolidation, renovations to their home or changing lenders and increasing the amount borrowed.”  By Neil Sharma.
Roundup of the latest mortgage and housing news. 
From Mortgage Professionals Canada. 
There is never a better time than now for a free mortgage check-up.  It makes sense for us to revisit your mortgage and ensure it still meets your needs and performs optimally.  Perhaps you’ve been thinking about refinancing to consolidate debt, purchasing a rental or vacation property, or simply want to know you have the best deal. Whatever your needs, we can evaluate your situation and help you determine what’s right for you.


Adriaan Driessen
Mortgage Broker 
Dominion Lending Forest City Funding 10671
Cell:     519.777.9374
Fax:      519.518.1081
415 Wharncliffe Road South
London, ON, N6J 2M3
Adriaan Driessen
Sales Representative & Partner
PC275 Realty Brokerage
Cell:     519.777.9374
Fax:      519.518.1081
415 Wharncliffe Road South
London, ON, N6J 2M3
Adriaan Driessen
Mortgage Broker 
Dominion Lending Forest City Funding 10671
Cell:     519.777.9374
Fax:      519.518.1081
415 Wharncliffe Road South
London, ON, N6J 2M3
Lori Richards Kovac
Mortgage Agent & Administrator
Dominion Lending Forest City Funding 10671
Cell:     519.852.7116
Fax:      519.518.1081
415 Wharncliffe Road South
London, ON, N6J 2M3
Adriaan Driessen
Sales Representative & Senior Partner
PC275 Realty Brokerage
Cell:     519.777.9374
Fax:      519.518.1081
415 Wharncliffe Road South
London, ON, N6J 2M3
21 Aug

Residential Market Update

Real Estate Market Update

Posted by: Adriaan Driessen

WEEKLY RESIDENTIAL  MARKET UPDATE 

pastedGraphic.png

Industry & Market Highlights 

Market improvements as expected

Improvements in the housing market that were forecast for the second half of this year appear to be materializing.

The July numbers from the Canadian Real Estate Association show a sales increase of 1.9% in July over June.  June was up more than 4% from May.  Year-over-year, however, July sales were off 1.3%, pulled down by fewer sales in major urban centres in British Columbia.  The decline in B.C. was offset by increases in the Greater Toronto Area, which saw an 18.6% jump from a year ago.

Home prices were down compared to June, but up modestly from a year ago.  The MLS Home Price Index recorded a 2.1% increase while the national average price was up by 1%.  Condominium apartments and townhouses led the way with increases of 10.1% and 4.7% respectively.  One and two-storey single family homes saw price declines of 0.7% and 1.5% respectively.

The average price for a home in Canada stands at $481,500.  With Toronto and Vancouver taken out, the average drops to $383,000.

In the GTA home prices dipped 0.6%.  In B.C. price increases slowed but still posted remarkable gains well into the double digits in some areas. (GVA: +6.7%; Fraser Valley: +13.8%; Victoria: 8.2%; elsewhere on Vancouver Island: +13.7%)

Calgary and Edmonton recorded small year-over-year declines of 1.7% and 1.3%.  Montreal posted a moderate increase of 5.7%.

The number of new listings was down by 1.2% putting the sales-to-new listings ratio at 55.9%.  The ratio’s long-term average is 53.4%.  By First National Financial.

Stats indicate adjustment to B-20

Real estate sales in Canada are trending upward and it’s likely an indication that consumers have come to grips with B-20.

Canadian Real Estate Association sales statistics for July show  national home sales rose 1.9% over the previous month—and according to REMAX’s regional executive vice president, that means buyers have finally adjusted to stricter qualification rules.

“It certainly looks like consumers are slowly becoming accustomed to the B-20 mortgage qualification guidelines,” said Elton Ash. “It’s occurring a little later than we thought, and that seems to be the reason why inventory levels are dropping in the Toronto area.”

While a tough pill to swallow for many, Canadians are realizing that in order to become homeowners, they’ll have to settle for less house.

“What’s occurring is they’re readjusting their expectations,” he said. “In other words, where they may have qualified previously to purchase an $850,000 home, they’re now looking at a $750,000 home. It’s not that they’re seeking secondary financing—because the only lenders not bound by B-20 are credit unions and private lenders—it’s reducing their overall expectations of what they can afford in the type of home they’re looking for.”

The real estate market, it would appear, has finally balanced, and Ash expects that to last through the first quarter of 2019. He added that last year’s record sales volume and price increases were an anomaly that people should be cognizant about before making drawing comparisons.

“When you measure against a record-setting year on a year-over-year basis, what appears to be negative is actually positive,” said Ash. “The whole B-20 mortgage qualification stress test was brought in to slow the market, and that is certainly what’s occurring, and what we’re getting into is more traditional market situation where it’s balanced overall. The days on market for homes are stretching out to what they were, and multiple offer situations have disappeared across the board, although in Toronto proper they occur in certain situations.”  By Neil Sharma.

CMHC introduces enhancements that provide flexibility for self-employed borrowers effective Oct. 1, 2018

I’m sure you’ve heard by now the CMHC has made some changes to how self-employed Canadians can access financing. The CMHC have kindly provided some details on the new guidelines:

Approximately 15% of Canadians are self-employed and may have difficulty accessing financing to buy a home, since their income sources may vary or be less predictable than employed borrowers. In line with the National Housing Strategy commitment to address the housing needs of Canadians along the housing continuum, CMHC is pleased to introduce enhancements that provide increased flexibility for satisfying income and employment requirements for self-employed borrowers.


The following table outlines enhancements to CMHC’s guidelines, which apply to transactional and portfolio insurance (1-4 unit residential properties):  Review it HERE.

The noted enhancements to CMHC’s guidelines for satisfying income and employment requirements for self-employed borrowers will become effective on October 1, 2018.

Please note that the establishment of these CMHC guidelines does not preclude Approved Lenders from observing their own lending practices.  As such, implementation of CMHC guidelines may vary among lenders.  By Dave Teixeira, Dominion Lending Centres.

pastedGraphic_1.png

Economic Highlights


Canadian Data Release: Existing home sales rose for 3rd straight month in July

·       Existing home sales rose 1.9% month-on-month in July, marking the third straight monthly gain. However, sales were downwardly revised in June to show 3.4% growth (previously 4.1%). More than half of all local markets reported increased activity in July, led by a solid 7.7% gain in the GTA. Sales also rose in Saskatoon (+12.3%), Ottawa (+1.4%), London (+2.5%), Hamilton-Burlington (+2.3%), Fraser Valley (+5.6%) and Victoria (+1.5%). Conversely, activity was lower in Calgary (-3.5%) and Winnipeg (-3.2%) while being flat in the GVA.

·       New listings dropped by 1.2% in July, weighed on by declines in Calgary (-8.0%), Edmonton (-7.2%) and the GVA (-4.4%). Meanwhile, listings advanced 5.1% in the GTA.

·       With new listings dropping and sales rising, the sales-to-new listings ratio increased to 55.9 in July – still reflective of balanced market conditions though inching closer to seller’s territory. Provincially, the ratio was highest in New Brunswick (71.3), PEI (66.7) and Quebec (62.4). Conversely, the ratio was lowest in Saskatchewan (39.2), Alberta (45.6) and Newfoundland and Labrador (33.0) – indicating loose conditions in these markets. In Ontario, the ratio increased to 59.7, its highest level since January.  The ratio also increased to 52.3 in B.C., though it still sits below its 10-year average.

·       The average home price rose for the fourth straight month in July (+1.0%) and was flat on a year-over-year basis – an improvement compared to the 1.3% year-over-year drop recorded in June.

·       The quality-adjusted MLS home price index was up 2.1% from a year-ago – also an improvement versus June’s 0.9% gain. Quality-adjusted prices were higher in most markets, with exception of the Prairies. Price growth was robust in Ottawa (7.2% y/y) and Montreal (5.7%). Prices were slightly lower in the GTA (-0.6% y/y), though this was a notable improvement from June (-4.8% y/y). In the GVA, price growth decelerated to its softest pace since 2014 (6.7% y/y).

Key Implications

·       July’s was a good month for housing markets, as sales increased for the third straight month alongside another rise in prices. This lends further credence to our view that markets have shaken off the bout of policy-induced weakness in the earlier part of the year.

·       Since April, sales have increased in 7 of 10 Provinces, with sharp gains in Ontario and New Brunswick. However, activity remains notably weak in B.C., where markets are being impacted by provincial policy measures in addition to the revised B-20 underwriting guidelines and rising borrowing costs. The imposition of a new housing speculation tax should place additional downward pressure on markets in B.C. in coming months.

·       We expect Canadian resale activity to improve at a gradual pace going forward, buoyed by a decent economic backdrop and solid population growth, though some restraint should come from rising borrowing costs. This should help residential investment add to overall growth in the second half of the year.   By Rishi Sondhi, TD Economist.

United States

·        Concerns about Turkey drove market volatility this week, but U.S. equity markets managed a rebound.

·        Strong retail sales and historically-high small business optimism suggest a strong economic expansion in the U.S. this quarter.

·        Although concerns eased by week’s end, Turkey is not out of the woods yet. It remains in the early stages of a balance of payments crisis, and is likely to trigger further bouts of market volatility.

Canada

·        Canadian economic data continued to impress this week. A solid resale housing report, respectable manufacturing numbers and surprisingly strong inflation all paint a picture of a healthy economy.

·        Of particular note, home sales rose for a third straight month, as did average sale prices. Evidence continues to mount that, as expected, the impact of cooling measures early in the year have been short-lived, even if there remains lots of lost ground left for sales to make up.

·        Economic risks remain very real, but continued solid out-turns suggest that the next policy interest rate hike is not that far off.

By TD Economics.  Read the full report Here.

pastedGraphic_2.png

Mortgage Interest Rates

Prime lending rate is 3.7%.  Bank of Canada Benchmark Qualifying rate for mortgage approval is at 5.34%.  Fixed rates are holding steady, no change in fixed rates.  Deep discounts are offered by some lenders for variable rates making adjustable variable rate mortgages very attractive.

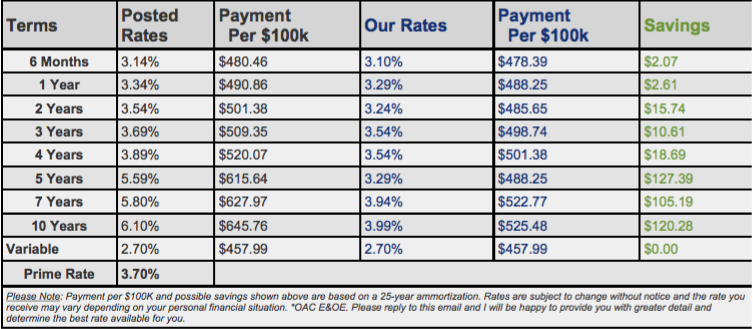
pastedGraphic_3.png
Terms Posted

Rates

Payment

  Per $100k

Our Rates Payment

  Per $100k

Savings
6 Months 3.14% $480.46 3.10% $478.39 $2.07
1 Year 3.04% $475.30 2.99% $472.73 $2.57
2 Years 3.44% $496.11 3.24% $485.65 $10.46
3 Years 3.59% $504.03 3.39% $493.48 $10.55
4 Years 3.89% $520.07 3.54% $501.38 $18.69
5 Years 5.59% $615.64 3.29% $488.25 $127.39
7 Years 5.80% $627.97 3.94% $522.77 $105.19
10 Years 6.10% $645.76 3.99% $525.48 $120.28
Variable 2.70% $457.99 2.41% $443.50 $14.49
Prime Rate 3.70%
Please Note: Payment per $100K and possible savings shown above are based on a 25-year ammortization. Rates are subject to change without notice and the rate you receive may vary depending on your personal financial situation. *OAC E&OE. Please reply to this email and I will be happy to provide you with greater detail and determine the best rate available for you.
This edition of the Weekly Rate Minder shows the latest rates available for Canadian mortgages. At Dominion Lending Centres, we work on your behalf to find the best possible mortgage to suit your needs.

Explore mortgage scenarios using helpful calculators on my website: http://www.iMortgageBroker.ca

pastedGraphic_4.png

Other Industry News & Insights

Why were so many borrowers renewing with the same lender last year?

According to a Canada Mortgage and Housing Corporation analysis, mortgage renewals with different lenders in Toronto declined dramatically in 2017 compared to the year before.

Tania Bourassa-Ochoa, a senior economic researcher with CMHC, theorizes that the 25.7% decline can be attributed to the B-20 rule changes in 2016.

“One of the reasons that could partially explain this is the mortgage rule changes in 2016,” Bourassa-Ochoa told MortgageBrokerNews.ca. “There was the stress test mortgages had to go through, but the problem is we’re not able to confirm this because we’re unable to observe the number of renewals with the same lenders. It’s hard to know if it’s really because of that.

“When you look at all of the major markets and you see the two most expensive markets in Toronto and Vancouver, that’s where the largest declines of renewals with different lenders was observed.”

While it is difficult to discount the role stress testing mortgages play in cooling activity—as well as the fact that lenders aren’t competitive with renewal rates to begin with—there could be another explanation for why so many borrowers decided to remain with their lenders.

“Historically speaking, lenders aren’t that competitive on renewal, especially if you look at 2016 to 2017 when they would come out with a subpar rate at best,” said Benjamin Sammut, a Mortgage Architects broker. “The only thing I can think of is they’re upping their game and starting to be a little more competitive in what they’re offering in terms of rate, and they’re probably contacting their clients a little earlier. What used to be 90 days out has turned into a 180 days out. We’ve even heard of instances where clients are being told a year in advance that they could do an early renewal.”

The decline in renewals with different lenders is confounding, though, because lenders don’t incent borrowers to stay with them.

“If they’re incentivized somewhere else and they can get the exact same product somewhere else, then they’re usually more inclined to do that,” said Sammut. “It’s like looking at Bell and Rogers: They’re the exact same product, but it’s a question of who’s going to screw you less.”

The CMHC analysis of Equifax data also determined that refinances declined in 2017 compared with a year earlier, and it’s likely because fewer homeowners were willing to leverage their properties, which is consistent with the decelerated price growth in some of the country’s major markets at the time.

“The only explanation I can think of is you have borrowers seeing a stricter environment,” said Bourassa-Ochoa. “People wanted to see what would happen because of the threat of rate increases and stricter and stricter regulation. They probably just wanted to hold off, and that included refinances for debt consolidation, renovations to their home or changing lenders and increasing the amount borrowed.”  By Neil Sharma.

Roundup of the latest mortgage and housing news.

From Mortgage Professionals Canada.

There is never a better time than now for free mortgage check-up.  It makes sense for us to revisit your mortgage and ensure it still meets your needs and performs optimally.  Perhaps you’ve been thinking about refinancing to consolidate debt, purchasing a rental or vacation property, or simply want to know you have the best deal. Whatever your needs, we can evaluate your situation and help you determine what’s right for you.


Adriaan Driessen

Mortgage Broker 

Dominion Lending Forest City Funding 10671

Cell:     519.777.9374

Fax:      519.518.1081

riebro@me.com

www.iMortgageBroker.ca

415 Wharncliffe Road South

London, ON, N6J 2M3

Adriaan Driessen

Sales Representative & Partner

PC275 Realty Brokerage

Cell:     519.777.9374

Fax:      519.518.1081

adriaan@pc275.com

www.PC275.com

415 Wharncliffe Road South

London, ON, N6J 2M3

10 Aug

WEEKLY RESIDENTIAL MARKET UPDATE

Real Estate Market Update

Posted by: Adriaan Driessen

WEEKLY RESIDENTIAL  MARKET UPDATE 
pastedGraphic.png
Industry & Market Highlights 
Report on the Housing and Mortgage Market in Canada
Mortgage Professionals Canada creates in-depth consumer reports to provide a better understanding of Canada’s housing market, identifying patterns in consumer behaviour, providing a snapshot of who the Canadian homebuyer is, and presenting data to provide both macro and micro analysis of where the residential mortgage market is headed.
New government policies are causing consumers to have a more negative outlook on housing and real estate in Canada, according to our newly released Report on the Housing and Mortgage Market in Canada.
While there is still broad agreement among consumers that real estate remains a good investment, the overall strength of consumer sentiment has been weakened by increasing interest rates and the new rules making it harder for homebuyers to secure mortgage financing.
The report suggests that some first-time buyers are finding ways to supplement their down payment with help from their parents. This is benefiting those fortunate to have family who have the financial means to assist them, but it is leaving a lot of middle-class Canadians behind. More and more young people are grasping the reality that they may never own a home.
With an increasing concern on income and wealth inequality, current policies that create a permanent generation of middle-class renters could increase wealth inequality as the ability to own homes and generate long-term equity becomes more and more difficult.
In addition, the report showcases that although the market is behaving the way it should in response to actual economic conditions, homebuying trends have been disrupted by stress tests. There has been a significant impact on supply and demand in almost every region of the country.
In Toronto and Vancouver, the weakened market has been seen as a welcome change, though elsewhere in the country it has proven to be more unstable, where conditions were already soft, and price stability is being replaced by price erosion.  Read the full report HERE.  By Mortgage Professionals Canada
Residential Market Commentary – An easing burden of debt
The good news is: the Canadian household debt to disposable income ratio is shrinking.
The latest numbers from Statistics Canada put debt to income at 168%, or $1.68 owing for every dollar available to spend, as of the end of the first quarter this year.  That is down from 170% in Q3 and 169.7% in Q4 of last year. 
Credit market debt rose by just 0.3% in Q1, while wages rose 1.3%.  Compared to the 4th quarter last year, mortgage borrowing declined by $2 billion to $13.7 billion in Q1, 2018.
The Bank of Canada sees it as a good sign, but Governor Stephen Poloz is quick to point out that Canadians are still carrying more than $2 trillion in household debt, and it will take some time before that debt load stops being a key concern.
While the Bank is keeping a close watch on how Canadians are responding to rising interest rates, the easing of the debt burden does allow room for further rate increases. By First National Financial 


Q2 Housing Market Data Now Available
Get national and provincial housing market information for the second quarter, including resale market data, housing starts, employment trends and interests rates, from the latest Housing Market Digests.  Mortgage Professionals Canada and its Chief Economist Will Dunning produce monthly Housing Market Digests to provide a snapshot and trend analysis of the Canadian – and respective regional – housing markets, content that includes information around housing starts, the resale market, employment trends, interest rates, and more.  View the full reports by selecting below.
Major markets are vulnerable: CMHC
A quarterly report from Canada Mortgage and Housing Corporation warns that Toronto and Vancouver are susceptible to corrections in the market.
“Housing markets for Vancouver, Toronto, Victoria and Hamilton remain highly vulnerable because of the detection of acceleration and overvaluation,” said Bob Dugan, CMHC’s Chief Economist, during a teleconference with reporters. “Most notably, high evidence of overvaluation is still observed in Vancouver, Victoria and Toronto, where house prices remain higher than levels supported by economic fundamentals.”
Prices are decreasing in the higher end of Vancouver’s luxury market, however, demand remains robust for everything below $1mln.
“Overall, the main story in Vancouver is we do continue to detect overvaluation,” said Eric Bond, a regional senior market analyst with CMHC. “We have price levels that are far higher than the upper predicted values from our price models.
“Nonetheless, we do observe a broad-based cooling in the Vancouver market. It’s become quite imbalanced between different sectors and geographies, where you have high demand and low inventories for properties under $1mln that are more affordable in the region.”
The national market has been vulnerable since mid-2016, but Dugan added that, while still early, there are signs of cooling.
“The assessment of the degree of vulnerability from the HMA [Housing Market Assessment] has been stable in recent quarters,” said Dugan. “Results continue to flag a high degree of overall vulnerability for the housing market at the national level for the eighth straight quarter. The rating is the result of detection of moderate evidence of overvaluation and price acceleration. Despite the stability in these results, we know the trends in overvaluation and price acceleration have been moving in such a way that suggests these vulnerabilities are gradually dissipating.”
Without a doubt, the dissipation is a direct result of the government’s intervention in the housing market. According to Mortgage Professionals Canada’s Report on the Housing and Mortgage Market in Canada, the stress test is being felt from coast to coast.
“We support a stress test, albeit at a reduced rate of 0.75%, as it is a useful tool to test a borrower’s ability to make future payments,” said Paul Taylor, MPC’s president and CEO. “However, the cumulative impact of rising rates, a 2% or greater stress test, provincial government rules in Ontario and British Columbia, and further lending restrictions are negatively suppressing housing activity not just in Toronto and Vancouver, but throughout the country.”  By Neil Sharma. 
LSTAR’s News Release for July 2018 – July Home Sales Reflect Robust Summer Season
London and St Thomas Association of REALTORS® (LSTAR) announced 1,000 homes* were sold in July, down 1.8% over the same time last year. July 2018 marked the third best July for home resales since the Association began tracking sales data in 1978.
“The numbers tell us we’re experiencing a very healthy summer for home resales,” said Jeff Nethercott, 2018 LSTAR President. “This is the third consecutive month of at least 1,000 homes being sold and the resale activity remains above the 10-year average. Inventory remains at a 10-year low, while we continue to see an increase in average sales price.”
By geographic area, London East continues to make the largest gains, with the average July sales price at $288,648 up 14.3% from July 2017 and up 40.2% compared to July 2015. The average sales price in London North was $441,035 up 8.0% from July 2017 and up 35.9% compared to July 2015. Meanwhile, the average sales price in London South was $370,399, up 10.9 percent from July 2017 and up 32.2% from July 2015.
Overall, the average July sales price across London and St. Thomas was $360,068 up 10.3% from July 2017 and up 34.2% from July 2015. Going back further, it’s a 68.2% increase compared to the average sales price 10 years ago.
“One of the biggest trends in 2018 is the lack of inventory,” Nethercott said. “In July, there were 1,721 active listings, down 10.9% from this time last year and down 55% from July 2015. The sales-to-new listings ratio was 78.9%, which the Canadian Real Estate Association (CREA) says represents conditions in the marketplace that favour sellers (a ratio between 40% and 60% is generally consistent with a balanced market). In London East, the sales-to-new listings ratio was 89.1%, while in London South it was 81%.”
St. Thomas saw a total of 79 homes sold in July, down 7.1% from the same period last year. For inventory, there were 87 active listings, down 22.3% from last July and down 67% from July 2015. The average home sales price in St. Thomas was $303,988 up 15.9% from July 2017 and up 35.5% from July 2015.
The following chart is based on data taken from the CREA National MLS® Report for June 2018 (the latest CREA statistics available). It provides a snapshot of how average home prices in London and St. Thomas compare to other major Ontario and Canadian centres.
pastedGraphic_1.png
According to a research report1, one job is created for every three real estate transactions and approximately $53,000 in ancillary spending is generated each time a home changes hands in Ontario. “The business of real estate affects all of us, with huge impact to the local economy, generating potentially more than $53 million in July,” Nethercott said. “The home resales have helped create approximately 333 jobs, making a significant contribution to the well-being and quality of life for the communities of London and St. Thomas.”
The London and St. Thomas Association of REALTORS® (LSTAR) exists to provide its REALTOR® Members with the support and tools they need to succeed in their profession. LSTAR is one of Canada’s 15 largest real estate associations, representing over 1,700 REALTORS® working in Middlesex and Elgin Counties, a trading area of 500,000 residents. LSTAR adheres to a Quality of Life philosophy, supporting growth that fosters economic vitality, provides housing opportunities, respects the environment and builds good communities and safe neighbourhoods and is a proud participant in the REALTORS Care Foundation’s Every REALTOR™ Campaign.
*These statistics are prepared for LSTAR by the Canadian Real Estate Association (CREA) and represent a data snapshot taken on August 1, 2018, based on processed home sales activity between July 1 and 31, 2018.
Condos remain dominant in GTA new homes market
The GTA new homes market is still all about condos even as prices rise while single-family home prices ease.
There were 2,500 new home sales in June and 2,079 of them were condo apartments in low, medium and high-rise buildings, stacked townhouses and loft units according to Altus Group data.
The Building Industry and Land Development Association (BILD) says that the sales were 61% below June 2017 which posted a record-high 5,290 new condo sales. However, June 2018 sales were only 17% below the 10-year average.
Meanwhile, the benchmark price of new GTA condos was up 23.5% year-over-year to $774,554.
For single-family homes, sales were down 19% from June 2017 with 421 units sold, 71% below the 10-year average. The benchmark price was down 9.4% year-over-year to $1,132,957.
“The relative strength of condo apartment sales is an indication of the state of the market,” said David Wilkes, BILD President and CEO. “The cost of new homes in the GTA, both condos and single-family homes, is affected by government regulation and red tape that slows down the building of new supply, and by government fees, taxes and charges, which can account for almost a quarter of the cost of a new home.”
Inventory increases for condos, single-family
New condo openings mean that inventory in June was up to 10,225 units while single-family home inventory also increased slightly to 4,848 units.
“The industry and buyers continue to focus on the relatively more affordable condominium apartment sector,” said Patricia Arsenault, Altus Group’s Executive Vice-President, Research Consulting Services. “Fourteen new condominium apartment projects were launched in the GTA last month, the second highest number for June yet recorded by Altus Group, and buyers snapped up almost half of the new units by month-end. In a typical June, closer to one-third of new units are sold by month-end.” By Steve Randall. 
pastedGraphic_2.png
Mortgage Interest Rates
Prime lending rate is 3.7%.  Bank of Canada Benchmark Qualifying rate for mortgage approval is at 5.34%.  Fixed rates are holding steady, no change in fixed rates.  Deep discounts are offered by some lenders for variable rates making adjustable variable rate mortgages very attractive.
pastedGraphic_3.png
Terms
Posted
Rates
Payment
  Per $100k
Our Rates
Payment
  Per $100k
Savings
6 Months
3.14%
$480.46
3.10%
$478.39
$2.07
1 Year
3.04%
$475.30
2.99%
$472.73
$2.57
2 Years
3.44%
$496.11
3.24%
$485.65
$10.46
3 Years
3.59%
$504.03
3.39%
$493.48
$10.55
4 Years
3.89%
$520.07
3.54%
$501.38
$18.69
5 Years
5.59%
$615.64
3.29%
$488.25
$127.39
7 Years
5.80%
$627.97
3.94%
$522.77
$105.19
10 Years
6.10%
$645.76
3.99%
$525.48
$120.28
Variable
2.7%
$457.99
2.70%
$457.99
$0.00
Prime Rate
3.70%
This edition of the Weekly Rate Minder shows the latest rates available for Canadian mortgages. At Dominion Lending Centres, we work on your behalf to find the best possible mortgage to suit your needs.
Explore mortgage scenarios using helpful calculators on my website: http://www.iMortgageBroker.ca
pastedGraphic_4.png
Other Industry News & Insights
Remote working impacting real estate
The telecommuting revolution envisioned by futurists, in which vast numbers of workers eschew their daily commute in favour of working remotely from home, never quite turned out as predicted.
However, a growing number of Canadians are taking the term “working remotely” literally, leaving the hustle and bustle of city life behind to work from their cottage or winter home down south, says a real estate expert.
“To the extent that that expands further, I think it will further enable the larger trend of working from places that you like,” said Brad Henderson, president and CEO of Sotheby’s International.
For many, that means avoiding the summer commute to cottage country.
“My place of pleasure is in Naples, Fla., not even in my country,” he said in an interview.
It is especially suited for consultants and senior executives with the flexibility to work remotely from anywhere with little need to visit a corporate office, said Henderson.
Many are choosing to take their profits from selling their home in the city and relocating to a property near a lake while perhaps maintaining a condo in the city.
He’s seen interest across the country from Montrealers relocating to the Laurentians or Eastern Townships, Torontonians heading to Muskoka, Collingwood and the Kawarthas and western Canadians choosing Banff, Canmore, Whistler and Kelowna.
When Vancouver home prices were especially crazy, Henderson said there was a trend of people selling and moving to Victoria.
“They could telecommute for most of what they needed and if they really needed to be in Vancouver, it’s a half an hour helicopter ride from harbour to harbour.”
Chris Van Lierop and his husband and business partner, Tim Wisener, took it a step further by relocating their home and design business to Fenelon Falls in Ontario’s Kawartha Lakes area.
The pair has changed their focus from designing city homes to helping city folks build cottage retreats.
They made the move last September after constantly prolonging the time they spent at the cottage.
“Eventually we just decided that we think we can make a go of our business up here and why not just stay at the cottage,” he said.
Internet service can be a challenge when they visit clients in areas where signals are harder to come by.
It’s the number one issue people ask about when planning to work from a cottage, says Jim Pine, chief administrative officer of Hastings County and co-lead on the non-profit Eastern Ontario Regional Network.
The network has spent $175 million to upgrade service in Eastern Ontario and is working on further changes to reach more homes and improve access and speeds.
“There’s still areas where there are challenges for people to either get a line of sight signal even on satellite. When you’ve got trees and stuff in the way, it makes it a bit of a challenge.”
Enticing people to conduct their business from the cottage is a way to ensure more services are available in rural areas by increasing tax revenues, said Denise Williams, acting manager of economic development for the city of Kawartha Lakes.
Rural communities need to attract new people to open businesses and provide the local services required to maintain a quality of life, said Terry Rees, executive director of the Federation of Ontario Cottagers’ Associations.
“There’s a ton of small businesses in rural Ontario that have no transition plan and no succession plan and many of them are in the sunsetting kind of phase and that’s got to be worrisome to everyone who’s concerned about the rural economy across Canada,” he said.
The federation recently sponsored a survey that found that 28 per cent of respondents currently work from their waterfront communities. Nine per cent work remotely full-time and 70 per cent do so occasionally.
Of those who don’t work from their waterfront communities, 37.5 per cent would consider doing so.
The three largest barriers they identified were access and cost of internet service, distance to clients and the lack of social infrastructure.
About one million of Canada’s 12.6 million households owns a second home.
Statistics Canada doesn’t track the number of people working from their cottages, but the share of non-farming Canadians working at home has remain unchanged since 1996 at just over six per cent.
Realtor Dean Michel moved with his young family to a family owned cottage because he was tired of the “Toronto rat race.”
“I thought if I can make it work up here, then I’m going to do it,” he said.
Michel said moving to the tranquility of the cottage is part of a societal shift for those near retirees or retirees.
“They just look at the end of their life and say, ‘I’ve got 20 to 30 years left or whatever, do I want to spend it in the rat race?”  By The Canadian Press. 
Why Canadian Millennials have another to resent Baby Boomers
First Canadian baby boomers reaped the benefit from one of the biggest housing-price increases in the country’s history. Now they’re driving up the cost of a country retreat, leaving millennials struggling yet again to get a foothold on the property ladder.
Prices of ski chalets, waterfront cottages and other vacation properties in Canada jumped 13% to a median $460,531 in the 12 months through June, according to brokerage RE/MAX Integra in a report on Thursday.
“Baby boomers who are entering their retirement, bought homes 30, 25-plus years ago, paid them off, and have gained tons of equity and are taking that equity out and buying second homes or are just selling their primary homes all together and buying a recreational property to retire at full time,” Christopher Alexander, executive vice president at real estate firm Re/Max Integra, said in an interview.
British Columbia had the biggest jump in prices among the provinces at 19%, with the cost of a waterfront property in Tofino soaring as much as 112% to $1.4m and 21% in the ski resort of Whistler to $790,000. In Ontario, prices jumped by 15%, with a waterfront spread in Wasaga Beach rising 18% to $950,000.
Prices on the Prairies by contrast fell 4% from the previous year amid an economic slowdown and the harsher impact of tighter mortgage-lending rules. Atlantic Canada prices remained flat.
Benchmark home prices jumped 46% to $637,500 in the five years through May, propelled by an 81% gain in Vancouver to $1.09m and rose 63% in Toronto to $772,400.  By Bloomberg.
Roundup of the latest mortgage and housing news. 
From Mortgage Professionals Canada. 
Now’s the perfect time of year for a free mortgage check-up.  With rates on the rise, it makes sense for us to revisit your mortgage and ensure it still meets your needs. Perhaps you’ve been thinking about refinancing to consolidate debt, purchasing a rental or vacation property, or you simply want to take a vacation. Whatever your needs, we can evaluate your situation and help you determine what’s right for you.
Adriaan Driessen
Mortgage Broker 
Dominion Lending Forest City Funding10671
Cell:519.777.9374
Fax: 519.518.1081
415 Wharncliffe Road South
London, ON, N6J 2M3
Lori Richards Kovac
Mortgage Agent & Administrator
Dominion Lending Forest City Funding10671
Cell:519.852.7116
Fax: 519.518.1081
415 Wharncliffe Road South
London, ON, N6J 2M3
Adriaan Driessen
Sales Representative & Senior Partner
PC275 Realty Brokerage
Cell:519.777.9374
Fax: 519.518.1081
415 Wharncliffe Road South
London, ON, N6J 2M3
6 Aug

Residential Market Update

Real Estate Market Update

Posted by: Adriaan Driessen

WEEKLY RESIDENTIAL  MARKET UPDATE 

pastedGraphic.png

Industry & Market Highlights 

Report on the Housing and Mortgage Market in Canada

Mortgage Professionals Canada creates in-depth consumer reports to provide a better understanding of Canada’s housing market, identifying patterns in consumer behaviour, providing a snapshot of who the Canadian homebuyer is, and presenting data to provide both macro and micro analysis of where the residential mortgage market is headed.

New government policies are causing consumers to have a more negative outlook on housing and real estate in Canada, according to our newly released Report on the Housing and Mortgage Market in Canada.

While there is still broad agreement among consumers that real estate remains a good investment, the overall strength of consumer sentiment has been weakened by increasing interest rates and the new rules making it harder for homebuyers to secure mortgage financing.

The report suggests that some first-time buyers are finding ways to supplement their down payment with help from their parents. This is benefiting those fortunate to have family who have the financial means to assist them, but it is leaving a lot of middle-class Canadians behind. More and more young people are grasping the reality that they may never own a home.

With an increasing concern on income and wealth inequality, current policies that create a permanent generation of middle-class renters could increase wealth inequality as the ability to own homes and generate long-term equity becomes more and more difficult.

In addition, the report showcases that although the market is behaving the way it should in response to actual economic conditions, homebuying trends have been disrupted by stress tests. There has been a significant impact on supply and demand in almost every region of the country.

In Toronto and Vancouver, the weakened market has been seen as a welcome change, though elsewhere in the country it has proven to be more unstable, where conditions were already soft, and price stability is being replaced by price erosion.  Read the full report HERE.  By Mortgage Professionals Canada

Residential Market Commentary – An easing burden of debt

The good news is: the Canadian household debt to disposable income ratio is shrinking.

The latest numbers from Statistics Canada put debt to income at 168%, or $1.68 owing for every dollar available to spend, as of the end of the first quarter this year.  That is down from 170% in Q3 and 169.7% in Q4 of last year.

Credit market debt rose by just 0.3% in Q1, while wages rose 1.3%.  Compared to the 4th quarter last year, mortgage borrowing declined by $2 billion to $13.7 billion in Q1, 2018.

The Bank of Canada sees it as a good sign, but Governor Stephen Poloz is quick to point out that Canadians are still carrying more than $2 trillion in household debt, and it will take some time before that debt load stops being a key concern.

While the Bank is keeping a close watch on how Canadians are responding to rising interest rates, the easing of the debt burden does allow room for further rate increases. By First National Financial 


Q2 Housing Market Data Now Available

Get national and provincial housing market information for the second quarter, including resale market data, housing starts, employment trends and interests rates, from the latest Housing Market Digests.  Mortgage Professionals Canada and its Chief Economist Will Dunning produce monthly Housing Market Digests to provide a snapshot and trend analysis of the Canadian – and respective regional – housing markets, content that includes information around housing starts, the resale market, employment trends, interest rates, and more.  View the full reports by selecting below.

Canada – July 2018.

Ontario – July 2018.

Major markets are vulnerable: CMHC

A quarterly report from Canada Mortgage and Housing Corporation warns that Toronto and Vancouver are susceptible to corrections in the market.

“Housing markets for Vancouver, Toronto, Victoria and Hamilton remain highly vulnerable because of the detection of acceleration and overvaluation,” said Bob Dugan, CMHC’s Chief Economist, during a teleconference with reporters. “Most notably, high evidence of overvaluation is still observed in Vancouver, Victoria and Toronto, where house prices remain higher than levels supported by economic fundamentals.”

Prices are decreasing in the higher end of Vancouver’s luxury market, however, demand remains robust for everything below $1mln.

“Overall, the main story in Vancouver is we do continue to detect overvaluation,” said Eric Bond, a regional senior market analyst with CMHC. “We have price levels that are far higher than the upper predicted values from our price models.

“Nonetheless, we do observe a broad-based cooling in the Vancouver market. It’s become quite imbalanced between different sectors and geographies, where you have high demand and low inventories for properties under $1mln that are more affordable in the region.”

The national market has been vulnerable since mid-2016, but Dugan added that, while still early, there are signs of cooling.

“The assessment of the degree of vulnerability from the HMA [Housing Market Assessment] has been stable in recent quarters,” said Dugan. “Results continue to flag a high degree of overall vulnerability for the housing market at the national level for the eighth straight quarter. The rating is the result of detection of moderate evidence of overvaluation and price acceleration. Despite the stability in these results, we know the trends in overvaluation and price acceleration have been moving in such a way that suggests these vulnerabilities are gradually dissipating.”

Without a doubt, the dissipation is a direct result of the government’s intervention in the housing market. According to Mortgage Professionals Canada’s Report on the Housing and Mortgage Market in Canada, the stress test is being felt from coast to coast.

“We support a stress test, albeit at a reduced rate of 0.75%, as it is a useful tool to test a borrower’s ability to make future payments,” said Paul Taylor, MPC’s president and CEO. “However, the cumulative impact of rising rates, a 2% or greater stress test, provincial government rules in Ontario and British Columbia, and further lending restrictions are negatively suppressing housing activity not just in Toronto and Vancouver, but throughout the country.”  By Neil Sharma. 

LSTAR’s News Release for July 2018 – July Home Sales Reflect Robust Summer Season

London and St Thomas Association of REALTORS® (LSTAR) announced 1,000 homes* were sold in July, down 1.8% over the same time last year. July 2018 marked the third best July for home resales since the Association began tracking sales data in 1978.

“The numbers tell us we’re experiencing a very healthy summer for home resales,” said Jeff Nethercott, 2018 LSTAR President. “This is the third consecutive month of at least 1,000 homes being sold and the resale activity remains above the 10-year average. Inventory remains at a 10-year low, while we continue to see an increase in average sales price.”

By geographic area, London East continues to make the largest gains, with the average July sales price at $288,648 up 14.3% from July 2017 and up 40.2% compared to July 2015. The average sales price in London North was $441,035 up 8.0% from July 2017 and up 35.9% compared to July 2015. Meanwhile, the average sales price in London South was $370,399, up 10.9 percent from July 2017 and up 32.2% from July 2015.

Overall, the average July sales price across London and St. Thomas was $360,068 up 10.3% from July 2017 and up 34.2% from July 2015. Going back further, it’s a 68.2% increase compared to the average sales price 10 years ago.

“One of the biggest trends in 2018 is the lack of inventory,” Nethercott said. “In July, there were 1,721 active listings, down 10.9% from this time last year and down 55% from July 2015. The sales-to-new listings ratio was 78.9%, which the Canadian Real Estate Association (CREA) says represents conditions in the marketplace that favour sellers (a ratio between 40% and 60% is generally consistent with a balanced market). In London East, the sales-to-new listings ratio was 89.1%, while in London South it was 81%.”

St. Thomas saw a total of 79 homes sold in July, down 7.1% from the same period last year. For inventory, there were 87 active listings, down 22.3% from last July and down 67% from July 2015. The average home sales price in St. Thomas was $303,988 up 15.9% from July 2017 and up 35.5% from July 2015.

The following chart is based on data taken from the CREA National MLS® Report for June 2018 (the latest CREA statistics available). It provides a snapshot of how average home prices in London and St. Thomas compare to other major Ontario and Canadian centres.

pastedGraphic_1.png

According to a research report1, one job is created for every three real estate transactions and approximately $53,000 in ancillary spending is generated each time a home changes hands in Ontario. “The business of real estate affects all of us, with huge impact to the local economy, generating potentially more than $53 million in July,” Nethercott said. “The home resales have helped create approximately 333 jobs, making a significant contribution to the well-being and quality of life for the communities of London and St. Thomas.”

The London and St. Thomas Association of REALTORS® (LSTAR) exists to provide its REALTOR® Members with the support and tools they need to succeed in their profession. LSTAR is one of Canada’s 15 largest real estate associations, representing over 1,700 REALTORS® working in Middlesex and Elgin Counties, a trading area of 500,000 residents. LSTAR adheres to a Quality of Life philosophy, supporting growth that fosters economic vitality, provides housing opportunities, respects the environment and builds good communities and safe neighbourhoods and is a proud participant in the REALTORS Care Foundation’s Every REALTOR™ Campaign.

*These statistics are prepared for LSTAR by the Canadian Real Estate Association (CREA) and represent a data snapshot taken on August 1, 2018, based on processed home sales activity between July 1 and 31, 2018.

Condos remain dominant in GTA new homes market

The GTA new homes market is still all about condos even as prices rise while single-family home prices ease.

There were 2,500 new home sales in June and 2,079 of them were condo apartments in low, medium and high-rise buildings, stacked townhouses and loft units according to Altus Group data.

The Building Industry and Land Development Association (BILD) says that the sales were 61% below June 2017 which posted a record-high 5,290 new condo sales. However, June 2018 sales were only 17% below the 10-year average.

Meanwhile, the benchmark price of new GTA condos was up 23.5% year-over-year to $774,554.

For single-family homes, sales were down 19% from June 2017 with 421 units sold, 71% below the 10-year average. The benchmark price was down 9.4% year-over-year to $1,132,957.

“The relative strength of condo apartment sales is an indication of the state of the market,” said David Wilkes, BILD President and CEO. “The cost of new homes in the GTA, both condos and single-family homes, is affected by government regulation and red tape that slows down the building of new supply, and by government fees, taxes and charges, which can account for almost a quarter of the cost of a new home.”

Inventory increases for condos, single-family

New condo openings mean that inventory in June was up to 10,225 units while single-family home inventory also increased slightly to 4,848 units.

“The industry and buyers continue to focus on the relatively more affordable condominium apartment sector,” said Patricia Arsenault, Altus Group’s Executive Vice-President, Research Consulting Services. “Fourteen new condominium apartment projects were launched in the GTA last month, the second highest number for June yet recorded by Altus Group, and buyers snapped up almost half of the new units by month-end. In a typical June, closer to one-third of new units are sold by month-end.” By Steve Randall. 

pastedGraphic_2.png

Mortgage Interest Rates

Prime lending rate is 3.7%.  Bank of Canada Benchmark Qualifying rate for mortgage approval is at 5.34%.  Fixed rates are holding steady, no change in fixed rates.  Deep discounts are offered by some lenders for variable rates making adjustable variable rate mortgages very attractive.

pastedGraphic_3.png
Terms Posted

Rates

Payment

  Per $100k

Our Rates Payment

  Per $100k

Savings
6 Months 3.14% $480.46 3.10% $478.39 $2.07
1 Year 3.04% $475.30 2.99% $472.73 $2.57
2 Years 3.44% $496.11 3.24% $485.65 $10.46
3 Years 3.59% $504.03 3.39% $493.48 $10.55
4 Years 3.89% $520.07 3.54% $501.38 $18.69
5 Years 5.59% $615.64 3.29% $488.25 $127.39
7 Years 5.80% $627.97 3.94% $522.77 $105.19
10 Years 6.10% $645.76 3.99% $525.48 $120.28
Variable 2.7% $457.99 2.70% $457.99 $0.00
Prime Rate 3.70%
This edition of the Weekly Rate Minder shows the latest rates available for Canadian mortgages. At Dominion Lending Centres, we work on your behalf to find the best possible mortgage to suit your needs.

Explore mortgage scenarios using helpful calculators on my website: http://www.iMortgageBroker.ca

pastedGraphic_4.png

Other Industry News & Insights

Remote working impacting real estate

The telecommuting revolution envisioned by futurists, in which vast numbers of workers eschew their daily commute in favour of working remotely from home, never quite turned out as predicted.

However, a growing number of Canadians are taking the term “working remotely” literally, leaving the hustle and bustle of city life behind to work from their cottage or winter home down south, says a real estate expert.

“To the extent that that expands further, I think it will further enable the larger trend of working from places that you like,” said Brad Henderson, president and CEO of Sotheby’s International.

For many, that means avoiding the summer commute to cottage country.

“My place of pleasure is in Naples, Fla., not even in my country,” he said in an interview.

It is especially suited for consultants and senior executives with the flexibility to work remotely from anywhere with little need to visit a corporate office, said Henderson.

Many are choosing to take their profits from selling their home in the city and relocating to a property near a lake while perhaps maintaining a condo in the city.

He’s seen interest across the country from Montrealers relocating to the Laurentians or Eastern Townships, Torontonians heading to Muskoka, Collingwood and the Kawarthas and western Canadians choosing Banff, Canmore, Whistler and Kelowna.

When Vancouver home prices were especially crazy, Henderson said there was a trend of people selling and moving to Victoria.

“They could telecommute for most of what they needed and if they really needed to be in Vancouver, it’s a half an hour helicopter ride from harbour to harbour.”

Chris Van Lierop and his husband and business partner, Tim Wisener, took it a step further by relocating their home and design business to Fenelon Falls in Ontario’s Kawartha Lakes area.

The pair has changed their focus from designing city homes to helping city folks build cottage retreats.

They made the move last September after constantly prolonging the time they spent at the cottage.

“Eventually we just decided that we think we can make a go of our business up here and why not just stay at the cottage,” he said.

Internet service can be a challenge when they visit clients in areas where signals are harder to come by.

It’s the number one issue people ask about when planning to work from a cottage, says Jim Pine, chief administrative officer of Hastings County and co-lead on the non-profit Eastern Ontario Regional Network.

The network has spent $175 million to upgrade service in Eastern Ontario and is working on further changes to reach more homes and improve access and speeds.

“There’s still areas where there are challenges for people to either get a line of sight signal even on satellite. When you’ve got trees and stuff in the way, it makes it a bit of a challenge.”

Enticing people to conduct their business from the cottage is a way to ensure more services are available in rural areas by increasing tax revenues, said Denise Williams, acting manager of economic development for the city of Kawartha Lakes.

Rural communities need to attract new people to open businesses and provide the local services required to maintain a quality of life, said Terry Rees, executive director of the Federation of Ontario Cottagers’ Associations.

“There’s a ton of small businesses in rural Ontario that have no transition plan and no succession plan and many of them are in the sunsetting kind of phase and that’s got to be worrisome to everyone who’s concerned about the rural economy across Canada,” he said.

The federation recently sponsored a survey that found that 28 per cent of respondents currently work from their waterfront communities. Nine per cent work remotely full-time and 70 per cent do so occasionally.

Of those who don’t work from their waterfront communities, 37.5 per cent would consider doing so.

The three largest barriers they identified were access and cost of internet service, distance to clients and the lack of social infrastructure.

About one million of Canada’s 12.6 million households owns a second home.

Statistics Canada doesn’t track the number of people working from their cottages, but the share of non-farming Canadians working at home has remain unchanged since 1996 at just over six per cent.

Realtor Dean Michel moved with his young family to a family owned cottage because he was tired of the “Toronto rat race.”

“I thought if I can make it work up here, then I’m going to do it,” he said.

Michel said moving to the tranquility of the cottage is part of a societal shift for those near retirees or retirees.

“They just look at the end of their life and say, ‘I’ve got 20 to 30 years left or whatever, do I want to spend it in the rat race?”  By The Canadian Press. 

Why Canadian Millennials have another to resent Baby Boomers

First Canadian baby boomers reaped the benefit from one of the biggest housing-price increases in the country’s history. Now they’re driving up the cost of a country retreat, leaving millennials struggling yet again to get a foothold on the property ladder.

Prices of ski chalets, waterfront cottages and other vacation properties in Canada jumped 13% to a median $460,531 in the 12 months through June, according to brokerage RE/MAX Integra in a report on Thursday.

“Baby boomers who are entering their retirement, bought homes 30, 25-plus years ago, paid them off, and have gained tons of equity and are taking that equity out and buying second homes or are just selling their primary homes all together and buying a recreational property to retire at full time,” Christopher Alexander, executive vice president at real estate firm Re/Max Integra, said in an interview.

British Columbia had the biggest jump in prices among the provinces at 19%, with the cost of a waterfront property in Tofino soaring as much as 112% to $1.4m and 21% in the ski resort of Whistler to $790,000. In Ontario, prices jumped by 15%, with a waterfront spread in Wasaga Beach rising 18% to $950,000.

Prices on the Prairies by contrast fell 4% from the previous year amid an economic slowdown and the harsher impact of tighter mortgage-lending rules. Atlantic Canada prices remained flat.

Benchmark home prices jumped 46% to $637,500 in the five years through May, propelled by an 81% gain in Vancouver to $1.09m and rose 63% in Toronto to $772,400.  By Bloomberg.

Roundup of the latest mortgage and housing news.

From Mortgage Professionals Canada.

Now’s the perfect time of year for a free mortgage check-up.  With rates on the rise, it makes sense for us to revisit your mortgage and ensure it still meets your needs. Perhaps you’ve been thinking about refinancing to consolidate debt, purchasing a rental or vacation property, or you simply want to take a vacation. Whatever your needs, we can evaluate your situation and help you determine what’s right for you.


Adriaan Driessen

Mortgage Broker 

Dominion Lending Forest City Funding 10671

Cell:     519.777.9374

Fax:      519.518.1081

riebro@me.com

www.iMortgageBroker.ca

415 Wharncliffe Road South

London, ON, N6J 2M3

Adriaan Driessen

Sales Representative & Partner

PC275 Realty Brokerage

Cell:     519.777.9374

Fax:      519.518.1081

adriaan@pc275.com

www.PC275.com

415 Wharncliffe Road South

London, ON, N6J 2M3

26 Jul

Residential Market Update

Real Estate Market Update

Posted by: Adriaan Driessen

WEEKLY RESIDENTIAL  MARKET UPDATE 

pastedGraphic.png

Industry & Market Highlights 

First Monthly Canadian Home Sales Gain This Year In June

National home sales rose by 4.1% in June compared to May, the first such rise this year. Even so, June’s sales activity remains well below the monthly pace of the past five years (see chart). The sales gains were led by the Greater Toronto Area (GTA) as 60% of all local housing markets reported increased existing home sales.

According to the Toronto Real Estate Board, sales were up 17.6% in the GTA on a seasonally adjusted basis between May and June.

In contrast, sales in British Columbia continued to moderate. The Real Estate Board of Greater Vancouver reported a 14.4% decline in home sales last month compared to the month before. June’s sales for the GVA were 28.7% below the 10-year June sales average. On a year-over-year (y/y) basis, sales declined a whopping 37.7%.

National home sales activity declined almost 11% y/y. Annual sales hit a five-year low and stood nearly 7% below the 10-year average for June. Activity came in below year-ago levels in about two-thirds of all local markets, led overwhelmingly by those in the Lower Mainland of British Columbia.

“This year’s new stress-test on mortgage applicants has been weighing on homes sales activity; however, the increase in June suggests its impact may be starting to lift,” said CREA President Barb Sukkau. “The extent to which the stress-test continues to sideline home buyers varies by housing market and price range.”

B.C. was hit with a double whammy as the province raised the foreign purchase tax as well. Also, mortgage rates have risen increasing the burden of the new stress tests.

Looking ahead, home sales and price gains will likely be dampened by higher interest rates as the Bank of Canada just hiked the benchmark rate once more last week. The prime rate rose from 3.45% to 3.70% in the wake of the rate hike, while the posted 5-year fixed mortgage rate–the critical stress-test yield–remained steady at 5.34%. Nevertheless, more upward pressure on mortgage rates is likely over the next couple of years as economic activity bumps up against capacity limits and inflation edges upward. The Bank made it very clear that further interest rate hikes are on the way but reiterated that it will be taking a gradual approach to future increases, guided by incoming economic data and a recognition that the economy is more sensitive to interest rate movements now than it was in the past.

pastedGraphic_1.png

New Listings

The number of newly listed homes fell in June by 1.8% and also remained below levels for the month in recent years. New listings declined in a number of large urban markets including those in B.C.’s Lower Mainland, Calgary Edmonton, Ottawa and Montreal.

With new listings up and sales virtually unchanged, the national sales-to-new listings ratio eased to 50.6% in May compared to 53.2% in April and stayed within short reach of the long-term average of 53.4%. Based on a comparison of the sales-to-new listings ratio with its long-term average, about two-thirds of all local markets were in balanced market territory in May 2018.

There were 5.7 months of inventory on a national basis at the end of May 2018. While this marks a three-year high for the measure, it remains near the long-term average of 5.2 months.

Home Prices

On a national basis, the Aggregate Composite MLS Home Price Index (HPI) rose only 0.9% y/y in June 2018, marking the 14th consecutive month of decelerating y/y gains. It was also the smallest annual increase since September 2009.

Decelerating y/y home price gains have reflected mainly trends at play in Greater Golden Horseshoe (GGH) housing markets tracked by the index. Home prices in the region have begun to stabilize and trend higher on a month-over-month basis in recent months.

Condo apartment units again posted the most substantial y/y price gains in June (+11.3%), followed by townhouse/row units (+4.9%); However, price gains for these homes have decelerated this year. By contrast, one-storey and two-storey single-family home prices were again down in June (-1.8% and -4.1% y/y respectively).

Benchmark home prices in June were up from year-ago levels in 8 of the 15 markets tracked by the index (see Table below).

Home price growth is moderating in the Lower Mainland of British Columbia (Greater Vancouver Area: +9.5% y/y; Fraser Valley: (+18.4%), Victoria (+10.6%) and elsewhere on Vancouver Island (+16.5%).

Within the GGH region, price gains have slowed considerably on a y/y basis but remain above year-ago levels in Guelph (+3.5%). By contrast, home prices in the GTA, Oakville-Milton and Barrie were down from where they stood one year earlier (GTA: -4.8%; Oakville-Milton: -2.9%; Barrie and District: -6.5%). The declines reflect rapid price growth recorded one year ago and masks recent month-over-month price gains in these markets.

Calgary and Edmonton benchmark home prices were down slightly on a y/y basis (Calgary: -1.0%; Edmonton: -1.5%), while prices declines in Regina and Saskatoon were comparatively more substantial (-6.1% and -2.9%, respectively).

Benchmark home prices rose by 7.9% y/y in Ottawa (led by a 9.1% increase in two-storey single-family home prices), by 6.4% in Greater Montreal (driven by a 7.4% increase in townhouse/row unit prices) and by 6% in Greater Moncton (led by a 6.5% increase in one-storey single-family home prices).

The actual (not seasonally adjusted) national average price for homes sold in June 2018 was just under $496,000, down 1.3% from one year earlier. While this marked the fifth month in a row in which the national average price was down on a y/y basis, it was the smallest decline among them.

The national average price is heavily skewed by sales in the Greater Vancouver and GTA, two of Canada’s most active and expensive markets. Excluding these two markets from calculations cuts almost $107,000 from the national average price, trimming it to just over $389,000.

Bottom Line

Housing markets continue to adjust to regulatory and government tightening as well as to higher mortgage rates. The speculative frenzy has cooled, and multiple bidding situations are no longer commonplace in Toronto and surrounding areas. The housing markets in the GGH appear to have bottomed, and supply constraints may well stem the decline in home prices in coming months. The slowdown in housing markets in the Lower Mainland of B.C. accelerated last month as the sector continues to reverberate from provincial actions to dampen activity, as well as the broader regulatory changes and higher interest rates.

Five-year fixed mortgage rates have already risen roughly 110 basis points, while rates for new variable mortgages rose by close to 40 basis points. Since the implementation of new mortgage standards, nonprice lending conditions for mortgages and home equity lines of credit have also tightened. Additional rate hikes by the Bank of Canada are coming, although the Bank will remain cautious particularly in light of continued trade tensions with the United States.

pastedGraphic_2.png

By Dr. Sherry Cooper. Chief Economist, Dominion Lending Centres

CREA releases June sales figures

The Canadian Real Estate Association says the number of homes sold in June was down 10.7 per cent from a year ago.

The result was a five-year low for the month of June.

However, sales volume was up 4.1 per cent when compared with May.

The association says it was the first substantive month-over-month increase this year.

The national average price for a home sold in June was just under $496,000, down 1.3 per cent from a year ago.

Excluding the Greater Vancouver and Greater Toronto markets, the average price was just over $389,000.  By The Canadian Press. 

Ontario markets outside Toronto see accelerated home price growth

While the Toronto residential market has seen the median cost of its housing shrink in Q2 2018, price growth accelerated in other major Ontario locales such as Kitchener, Waterloo, Cambridge, according to the latest Royal LePage House Price Survey and Market Survey Forecast.

The average price of a standard 2-storey home increased by 8.9% annually across the region (up to $515,733) in the second quarter of the year. Meanwhile, the median price of a bungalow grew by 6.2% year-over-year (up to $443,572), and the average price of a condominium rose by 5.1% in the same time frame (up to $287,080).

However, Royal LePage Grand Valley Realty broker and owner Keith Church stressed that “while prices are up across all housing categories year-over-year, the rate of appreciation has slowed compared to last quarter’s double-digit year-over-year gains. We are beginning to see a shift towards a balanced market where sales and prices are more stable.”

Church added that the region’s economic growth is pulling buyers from the Greater Toronto Area. Royal LePage is also predicting a healthy influx of first-time buyers and retirees looking to downsize into new condominiums.

The aggregate price of a home in the Kitchener/Waterloo/Cambridge area increased by 8.2% year-over-year in Q2 2018 (up to $485,946). Housing costs in the region are expected to continue increasing at a steady rate in the next quarter, the report noted.

On the national level, price appreciation slowed to a relative crawl in Q2 2018, a development influenced mainly by what was characterized as “softness” in the GTA, where many markets have suffered year-over-year declines in home prices. By Ephraim Vecina.

CMHC’s new rules

Canada Mortgage and Housing Corporation is making a couple moves that will send ripples through the mortgage market.  One could give lenders access to more confidential financial information about borrowers.  The other could ease frustrations for a group of borrowers that has consistently had problems securing loans.

According to documents obtained by Reuters, through a freedom of information request, the federal housing agency wants the Canada Revenue Agency to take a “more direct and formal role” in verifying income statements made on mortgage applications.  Right now the CRA does not verify income claims for lenders, even with the permission of the borrower/taxpayer.

A two-year plan drafted by CMHC shows the agency is concerned about a systemic risk posed by mortgage fraud.  The agency has said there is no evidence of widespread fraud in Canada, but it also says its information is limited.

The CMHC plan says paperless transactions, pressures to close deals quickly, rising prices and new regulations can “create strong incentives for individuals or mortgage professionals to engage in … fraud.”  A spokesperson also says CMHC is developing data-driven systems to screen for commission fraud, where a lender or a broker may have encouraged a borrower to exaggerate income claims.  The documents reveal the agency intends to start publishing statistics on mortgage fraud.

At the same time CMHC says it wants to make it easier for the self-employed to qualify for a mortgage.  The agency says it is giving lenders more guidance and flexibility to help self-employed borrowers.  The effort focuses on those who have been running their business – or have been in the same line of work – for less than 24 months.  The new policy is set to take effect October 1st.  By First National Financial

CMHC makes announcement regarding self-employed borrowers

Canada Mortgage and Housing Corp. is making changes intended to make it easier for the self-employed to qualify for a mortgage.

The national housing agency says it’s giving lenders more guidance and flexibility to help self-employed borrowers.

Self-employed Canadians may have a harder time qualifying for a mortgage as their incomes may vary or be less predictable.

CMHC is providing examples of factors that can be used to support the lender’s decision to lend to borrowers who have been operating their business for less than 24 months, or in the same line of work for less than 24 months.

It is also providing a broader range of documentation options to increase flexibility for satisfying income and employment requirements.

The changes, which apply to both transactional and portfolio insurance, will take effect Oct. 1.

CMHC chief commercial officer Romy Bowers said self-employed Canadians represent a significant part of the workforce.

“These policy changes respond to that reality by making it easier for self-employed borrowers to obtain CMHC mortgage loan insurance and benefit from competitive interest rates,” Bowers said in as statement.  By Canadian Press. 

pastedGraphic_3.png

Economic Highlights


Jasson Ellis looks at the latest in government bond yields

Greetings mortgage market participants,

Forgive me gentle readers.  It’s been a month since my last post and it feels like at least twice that long.

In my defense, I’ve been occupied by some ‘deep thoughts’ that have kept me distracted.  For instance, I’ve been thinking that maybe to understand mankind we have to look at the word itself: “Mankind”.  Basically, it’s made up of two separate words, mank and ind.  What do these words mean?  It’s a mystery, and that’s why mankind is too.

I’ve also been thinking that if dogs ever take over the world, and they choose a king, I hope they don’t just go by size, because I bet there are Chihuahuas out there with some good ideas.

Economic Data

Today’s data featured two top tier Canadian reports, Retail Sales and Consumer Price Index (“CPI”).

Month over month retail sales in May came in at +2.0% and +1.4% ex-autos, exceeding expectations of +1.0% and +0.5% respectively.  Headline CPI for June came in a little hot at 2.5% year over year vs. 2.3% expected and 2.2% last month  ‘Core’ CPI came in as expected a 1.9%, right around the BoC 2.0% target.

Rates

Rates have jumped about 4 basis points higher on today’s data but Government bond yields in Canada continue to be relatively range bound.  5 year GoC’s are around 2.06% and have traded between 2.00% and 2.10% the last five weeks.  10 year GoC’s are around 2.15% and have traded between 2.10% and 2.20% over the same horizon.  Yes…you read that right.  There are less than 10 basis points between the 5 and 10 year benchmarks.  In fact, there are only 20 basis points between the 2 year (1.95%) and the 30 year (2.15%) bond.  It’s a flat curve all right.  Flattest it’s been in a decade.  I don’t want to alarm you, but your first year Economics text book will tell you that a flat yield curve is an indication that investors and traders are worried about the macro-economic outlook.  A less pessimistic argument is that it’s only natural when a central bank is raising short-term interest rates.  Whatever the reason, if you’re getting a “glass half empty” feeling, just add vodka and stir.

Speaking of central banks, following the July 11th rate hike, the next BoC meeting is September 5th.  The implied probability of another then hike is a modest 10%.  No doubt lingering uncertainty with respect to NAFTA, auto tariffs and broader trade drama are creating headwinds.  Despite the small pop in rates this morning, the market won’t lean too heavily on the modestly stronger than expected retail sales and CPI data today.

Securitization news

On Wednesday, RBC priced a new offering of CMBS in the form Real Estate Asset Liquidity Trust, better known as REAL-T.  It’s the second Canadian CMBS transaction of 2018 and the sixth issuance of REAL-T since its post liquidity crisis return to the market in 2014.

The simple senior/subordinate sequential pass through structure featured a 3.5 year A-1 note and a 7.5 year A-2 note.  Both rated ‘AAA’ by DBRS and Fitch with 13.25% credit support from subordinate notes.  The A-1 priced at GoC +105 and the longer A-2 priced at GoC+155.  An attractive spread for a ‘AAA’ note considering the current delinquency rate on all outstanding Canadian CMBS issuance since 1998 is a microscopic 0.08%.  For context, the last REAL-T deal was issued in October 2017 and the A-1/A-2 notes were priced at +125/+175 or 20bps wider than this week’s deal.

The roughly $350 million pool was made up of 70 loans across 140 properties with loan to value < 60% and a weighted average remaining term of 6.67 years.

No new ‘syndicated’ NHA MBS deals to mention but the indicative spread for a new 5 year single family residential pool is around +48, virtually unchanged since January.  That’s impressive considering Bank Deposit notes have widened since January from about +65 to +90.  The outperformance by MBS can be partially explained by reduced issuance compared to last year and the special utility of MBS for Federally Regulated Financial Institutions (“FRFIs”) as Tier 1 High Quality Liquid Assets (“HQLA”).

Finally, CMHC’s call for allocation requests came out yesterday for next month’s 10 year CMB issue.  It will be the first opening (of three) for the new December 2028 maturity date.  Yes…it’s 124 months for the price of 120!  Send in your deals!

Heading into the weekend

Take it easy this weekend and remember, it’s always a good idea to carry two sacks of something when you walk around.  That way, if anybody asks “Hey, can you give me a hand?”, you can say, “Sorry, got these sacks”.

Sometimes I wish I were a nicer person…but then I laugh and continue my day.  By Jason Ellis, Senior Vice President and Managing Director, Capital Markets.

United States

·       Economic data was a mixed bag this week: retail sales were a bright spot, but housing starts unexpectedly plunged in June.

·       Trade developments continued to make headlines, with Donald Trump announcing he was prepared to extend duties on $500bn of imports from China – roughly the value of all China’s imports into the U.S.

·       In his testimony to Congress, Fed Chair Powell offered an upbeat view of the U.S. economy, and noted that the risks posed by trade protectionism would not push them off course on further rate hikes.


Canada

·       It was a good week for Canadian data releases, with positive surprises in retail, manufacturing, and housing, affirming last week’s upbeat tone set by the Bank of Canada.

·       Existing home sales were particularly positive, and, taken together with last week’s housing starts, support the view that the housing market is gradually stabilizing following the implementation of B-20 guidelines.

·       The U.S. announced that it will probe tariffs on uranium imports, increasing already-heightened global trade uncertainty risks. By TD Economics.  Read the full report Here.

pastedGraphic_4.png

Mortgage Interest Rates

No change to Prime lending rate currently at 3.7%.  Bank of Canada Benchmark Qualifying rate for mortgage approval is at 5.34%.  Fixed rates are holding steady, no change in fixed rates.  Deep discounts are are available for variable rates making adjustable variable rate mortgages very attractive for the right borrowers.

pastedGraphic_5.png
Terms Posted

Rates

Payment

  Per $100k

Our Rates Payment

  Per $100k

Savings
6 Months 3.14% $480.46 3.10% $478.39 $2.07
1 Year 3.04% $475.30 2.99% $472.73 $2.57
2 Years 3.44% $496.11 3.24% $485.65 $10.46
3 Years 3.59% $504.03 3.39% $493.48 $10.55
4 Years 3.89% $520.07 3.54% $501.38 $18.69
5 Years 5.59% $615.64 3.29% $488.25 $127.39
7 Years 5.80% $627.97 3.94% $522.77 $105.19
10 Years 6.10% $645.76 3.99% $525.48 $120.28
Variable 2.70% $457.99 2.66% $455.97 $2.01
Prime Rate 3.70%
Please Note: Payment per $100K and possible savings shown above are based on a 25-year ammortization. Rates are subject to change without notice and the rate you receive may vary depending on your personal financial situation. *OAC E&OE. Please reply to this email and I will be happy to provide you with greater detail and determine the best rate available for you.
This edition of the Weekly Rate Minder shows the latest rates available for Canadian mortgages. At Dominion Lending Centres, we work on your behalf to find the best possible mortgage to suit your needs.

Explore mortgage scenarios using helpful calculators on my website: http://www.iMortgageBroker.ca

pastedGraphic_6.png

  • We are Canada’s largest and fastest-growing mortgage brokerage!
  • We have more than 2,600 Mortgage Professionals from more than 350 locations across the country!
  • Our Mortgage Professionals are Experts in their field and many are ranked among the best nationally.
  • We work for you, not the lenders, so your best interests will always be our number one priority.
  • We have more than 100 mortgage programs, making it easy to choose the best fit for your unique situation.
  • We close loans in all 10 provinces and 3 territories.
  • We can process your mortgage in as few as 7 days.
  • We are the preferred mortgage lender for several of Canada’s top companies.
  • Dominion Lending Centres’ Mortgage Professionals are available anytime, anywhere, evenings and weekends – and we’ll even come to you!

pastedGraphic_7.png

Other Industry News & Insights

How Do Interest Rates Affect the Stock Market?

The investment community and the financial media tend to obsess over interest rates—the cost someone pays for the use of someone else’s money— and with good reason. When the Federal Open Market Committee (FOMC) sets the target for the federal funds rate at which banks borrow from and lend to each other, it has a ripple effect across the entire U.S. economy, not to mention the U.S. stock market. And, while it usually takes at least 12 months for any increase or decrease in interest rates to be felt in a widespread economic way, the market’s response to a change (or news of a potential change) is often more immediate.

Understanding the relationship between interest rates and the stock markets can help investors understand how changes might affect their investments and how to make better financial decisions.


The Interest Rate That Impacts Stocks

The interest rate that moves markets is the federal funds rate. Also known as the overnight rate, this is the rate depository institutions are charged for borrowing money from Federal Reserve banks.

The federal funds rate is used by the Federal Reserve (the Fed) to attempt to control inflation. Basically, by increasing the federal funds rate, the Fed attempts to shrink the supply of money available for purchasing or doing things, by making money more expensive to obtain. Conversely, when it decreases the federal funds rate, the Fed is increasing the money supply and, by making it cheaper to borrow, encouraging spending. Other countries’ central banks do the same thing for the same reason.

Why is this number, what one bank pays another, so significant? Because the prime interest rate—the interest rate commercial banks charge their most credit-worthy customers—is largely based on the federal funds rate. It also forms the basis for mortgage loan rates, credit card annual percentage rates (APRs) and a host of other consumer and business loan rates.

What Happens When Interest Rates Rise?

When the Fed increases the federal funds rate, it does not directly affect the stock market itself. The only truly direct effect is it becomes more expensive for banks to borrow money from the Fed. But, as noted above, increases in the federal funds rate have a ripple effect.

Because it costs them more to borrow money, financial institutions often increase the rates they charge their customers to borrow money. Individuals are affected through increases to credit card and mortgage interest rates, especially if these loans carry a variable interest rate. This has the effect of decreasing the amount of money consumers can spend. After all, people still have to pay the bills, and when those bills become more expensive, households are left with less disposable income. This means people will spend less discretionary money, which will affect businesses’ revenues and profits.

But businesses are affected in a more direct way as well because they also borrow money from banks to run and expand their operations. When the banks make borrowing more expensive, companies might not borrow as much and will pay higher rates of interest on their loans. Less business spending can slow the growth of a company; it might curtail expansion plans or new ventures, or even induce cutbacks. There might be a decrease in earnings as well, which, for a public company, usually means the stock price takes a hit.

Interest Rates and the Stock Market

So now we see how those ripples can rock the stock market. If a company is seen as cutting back on its growth or is less profitable—either through higher debt expenses or less revenue—the estimated amount of future cash flows will drop. All else being equal, this will lower the price of the company’s stock. (For related reading, see: Taking Stock of Discounted Cash Flow.)

If enough companies experience declines in their stock prices, the whole market, or the key indexes (e.g., Dow Jones Industrial Average, S&P 500) many people equate with the market, will go down. With a lowered expectation in the growth and future cash flows of the company, investors will not get as much growth from stock price appreciation, making stock ownership less desirable. Furthermore, investing in equities can be viewed as too risky compared to other investments.

However, some sectors do benefit from interest rate hikes. One sector that tends to benefit most is the financial industry. Banks, brokerages, mortgage companies and insurance companies’ earnings often increase as interest rates move higher, because they can charge more for lending.

Interest Rates and the Bond Market

Interest rates also affect bond prices and the return on CDs, T-bonds and T-bills. There is an inverse relationship between bond prices and interest rates, meaning as interest rates rise, bond prices fall, and vice versa. The longer the maturity of the bond, the more it will fluctuate in relation to interest rates. (For related reading, see: How Bond Market Pricing Works.)

When the Fed raises the federal funds rate, newly offered government securities, such Treasury bills and bonds, are often viewed as the safest investments and will usually experience a corresponding increase in interest rates. In other words, the “risk-free” rate of return goes up, making these investments more desirable. As the risk-free rate goes up, the total return required for investing in stocks also increases. Therefore, if the required risk premium decreases while the potential return remains the same or dips lower, investors might feel stocks have become too risky and will put their money elsewhere.

One way governments and businesses raise money is through the sale of bonds. As interest rates move up, the cost of borrowing becomes more expensive. This means demand for lower-yield bonds will drop, causing their price to drop. As interest rates fall, it becomes easier to borrow money, causing many companies to issue new bonds to finance new ventures. This will cause the demand for higher-yielding bonds to increase, forcing bond prices higher. Issuers of callable bonds may choose to refinance by calling their existing bonds so they can lock in a lower interest rate.

For income-oriented investors, reducing the federal funds rate means a decreased opportunity to make money from interest. Newly issued treasuries and annuities won’t pay as much. A decrease in interest rates will prompt investors to move money from the bond market to the equity market, which then starts to rise with the influx of new capital.

What Happens When Interest Rates Fall?

When the economy is slowing, the Federal Reserve cuts the federal funds rate to stimulate financial activity. A decrease in interest rates by the Fed has the opposite effect of a rate hike. Investors and economists alike view lower interest rates as catalysts for growth—a benefit to personal and corporate borrowing, which in turn leads to greater profits and a robust economy. Consumers will spend more, with the lower interest rates making them feel they can finally afford to buy that new house or send the kids to a private school. Businesses will enjoy the ability to finance operations, acquisitions and expansions at a cheaper rate, thereby increasing their future earnings potential, which, in turn, leads to higher stock prices.

Particular winners of lower federal funds rates are dividend-paying sectors such as utilities and real estate investment trusts (REITs). Additionally, large companies with stable cash flows and strong balance sheets benefit from cheaper debt financing. 

Impact of Interest Rates on Stocks

Nothing has to actually happen to consumers or companies for the stock market to react to interest-rate changes. Rising or falling interest rates also affect investors’ psychology, and the markets are nothing if not psychological. When the Fed announces a hike, both businesses and consumers will cut back on spending, which will cause earnings to fall and stock prices to drop, everyone thinks, and the market tumbles in anticipation. On the other hand, when the Fed announces a cut, the assumption is consumers and businesses will increase spending and investment, causing stock prices to rise.

However, if expectations differ significantly from the Fed’s actions, these generalized, conventional reactions may not apply. For example, let’s say the word on the street is the Fed is going to cut interest rates by 50 basis points at its next meeting, but the Fed announces a drop of only 25 basis points. The news may actually cause stocks to decline because assumptions of a 50-basis-points cut had already been priced into the market. (For related reading, see: 8 Pshychological Traps Investors Should Avoid.)

The business cycle, and where the economy is in it, can also affect the market’s reaction. At the onset of a weakening economy, the modest boost provided by lower rates is not enough to offset the loss of economic activity, and stocks continue to decline. Conversely, towards the end of a boom cycle, when the Fed is moving in to raise rates—a nod to improved corporate profits—certain sectors often continue to do well, such as technology stocks, growth stocks and entertainment/recreational company stocks.

The Bottom Line

Although the relationship between interest rates and the stock market is fairly indirect, the two tend to move in opposite directions: as a general rule of thumb, when the Fed cuts interest rates, it causes the stock market to go up; when the Fed raises interest rates, it causes the stock market as a whole to go down. But there is no guarantee how the market will react to any given interest rate change the Fed chooses to make. By Mary Hall.

Roundup of the latest mortgage and housing news.

From Mortgage Professionals Canada.

Now’s the perfect time of year for a free mortgage check-up. With spring on its way and interest rates on the rise, it makes sense for us to revisit your mortgage and ensure it still meets your needs. Perhaps you’ve been thinking about refinancing to consolidate debt, purchasing a rental or vacation property, or you simply want to take a vacation. Whatever your needs, we can evaluate your situation and help you determine what’s right for you.


Adriaan Driessen

Mortgage Broker 

Dominion Lending Forest City Funding 10671

Cell:     519.777.9374

Fax:      519.518.1081

riebro@me.com

www.iMortgageBroker.ca

415 Wharncliffe Road South

London, ON, N6J 2M3

Lori Richards Kovac

Mortgage Agent & Administrator

Dominion Lending Forest City Funding 10671

Cell:     519.852.7116

Fax:      519.518.1081

loriakovac@icloud.com

415 Wharncliffe Road South

London, ON, N6J 2M3

Adriaan Driessen

Sales Representative & Senior Partner

PC275 Realty Brokerage

Cell:     519.777.9374

Fax:      519.518.1081

adriaan@pc275.com

www.PC275.com

415 Wharncliffe Road South

London, ON, N6J 2M3

24 Jul

FIRST TIME HOME BUYERS –  Mortgage Financing Qualifying Frustrations and Solutions for Home Ownership

Mortgage Market Update

Posted by: Adriaan Driessen

FIRST TIME HOME BUYERS –  Mortgage Financing Qualifying Frustrations and Solutions for Home Ownership. 
Are you a first time home buyer or repeat buyer feeling frustrated in your price point qualification due to the new mortgage lending guidelines that created an affordability issue for most borrowers?
The general consensus in the industry is that first time home buyers are getting very discouraged due to the tight lending rules and the increasing affordability gap together with rapidly increasing home prices in peripheral markets outside the GTA that are experiencing increased demand, short supply, sellers markets and rapidly increase home values.
There will also be a cost of living, but the benefit of ownership and building your equity for long time financial success and net worth growth, far outweighs continued renting pared with saving instead.   The sooner you get your foot in the door in the real estate market, the sooner you’ll start realizing that benefit – even if it means purchasing a smaller home, a condo instead of the freehold property, or a property in another more affordable market that may require commuting.
A recent article by Neil Sharma indicates that According to a report by Altus Group, the preponderant reason for the languid housing market this year has been the absence of first-time buyers—but they’ll be back soon and the market will resultantly recover. “With all the policy changes we’ve had and additional stress testing, they have knocked many first-time buyers out of the market for a while, but part of what they’re doing is saving money. They’ll be back,” said Patricia Arsenault, vice president of research and consulting services at Altus Group. “Particularly among younger renters; they’re inclined to buy homes. Because of their ability at the moment, they’re saving longer and tapping resources from parents to help them out, but they’ll be back in the short-term. There’s nothing out there that says they don’t want to own homes anymore.”  
Arsenault added that, by autumn, housing sales will markedly improve. “People are saving for down payments,” she said. “Savings rates are up in Canada and that money is being used for better down payments.” The Altus Group Housing Report furthermore elucidates how instrumental first-time homebuyers are to the health of the Canadian real estate market. They account for somewhere around half of all housing sales, but, unlike years past, they have been forced to the sidelines in 2018. Given the housing market’s interconnectedness, fewer first-time buyers occlude other buyers from moving up the housing ladder. “The important role that first-time buyers play is that if I’m a repeat buyer trying to move up to something more expensive, I need somebody to buy my house,” said Arsenault. “If first-time buyers aren’t there, there’s nobody to buy my house, so they make the world go around, if you want to put it that way.”
The good news is that there are solutions if your current pre-qualification falls short of your needs and goals.
Connect with an experience mortgage broker to review these options with you:
1. Gifted funds for 20% Down Conventional Mortgage.
There are select A lenders that will still qualify borrowers under traditional non B20 guidelines, which will place you at a higher price point for qualifying.  Contact an experience mortgage broker for access to those lenders.
2. Strong co-signer.  
With a strong Co-Signer to help you qualify for the mortgage financing you could qualify at a much higher price point.  This option will be a 4-5 year plan during which you’ll fully a program created by your broker to help you qualify by yourself at renewal.  At maturity we will refinance and remove the co-singer/s off mortgage and title and original the best mortgage in your name only.  Title will at closing be registered tenancy in common at 99% in your name and 1% for the co-signer to minimize future tax implication and maximize land transfer tax rebate benefits for first time buyers. 
3.  Alternative Lender Combination Mortgage Up To 95% LTV.
With alternative lenders the interest rate and cost of ownership will be higher.  This will be a combination 1st mortgage up to 80% loan to value, and 2nd mortgage up to 95% if you qualify.  With this mortgage solution you will follow a guideline and goal to qualify you for an A lender lower rate mortgage once you have grown your equity position qualify to refinance at 80% loan to value with and A lender mortgage.  It will take estimated 3-5 years depending on your property and original LTV. 
4.  Rent to Own.
Another options that you may consider is Rent to Own.  This could allow you to get into your desired home now instead of waiting years.  During the term you will build equity in your home while making monthly rent payments, and at the same time you will follow the rent to own program guideline in order to qualify for the mortgage once the rent to own term is complete and you can exercise your option to purchase from the investor and take ownership and title of your home.  Consult with your mortgage broker to see if you would qualify for a Rent to Own Program and time find out more about it.
5.  Vendor Take Back Mortgage.
A vendor take back mortgage as part of the agreement of purchase and sale could allow you to purchase with as little down as the buyer and seller agrees to, with interest rate and terms as negotiated with the vendor.  Depending your your original down payment amount and mortgage loan to value, this option will be a 3-5 year plan during which you’ll follow your mortgage brokers guideline to help you qualify for an institutional mortgage at maturity to pay out the sellers mortgage.  
6.  Joint Venture / Co-Ownership.
Purhcase with another like minded person that you trust, and that shares in your goals.  Consult with your broker for the important ins and outs and need to know details about such a venture and qualification options under this program.  You will also get independent legal advise and create a joint venture / co-ownership agreement prior to entering into this type of ownership.
7. Prepare to Qualify for an A Mortgage 2 year Plan.
If not of the above options suit your preference nor works out for your needs, then follow the custom home ownership plan your mortgage broker creates for you to help you get to the place where you qualifying for your desired home.  This normally includes plans to help you increase your income, fully establish your credit and save up for the future home purchase down payment and closing cost.  The timeline will depend on your personal circumstances and needs.
Contact us today if you have any questions or need assistance. 
We are always at your service and ready to assist you with your mortgage financing needs!
 
Adriaan Driessen
Mortgage Broker 
Dominion Lending Forest City Funding 10671
Cell:     519.777.9374
Fax:      519.518.1081
415 Wharncliffe Road South
London, ON, N6J 2M3
Lori Richards Kovac
Mortgage Agent & Administrator
Dominion Lending Forest City Funding 10671
Cell:     519.852.7116
Fax:      519.518.1081
415 Wharncliffe Road South
London, ON, N6J 2M3
Adriaan Driessen
Sales Representative & Senior Partner
PC275 Realty Brokerage
Cell:     519.777.9374
Fax:      519.518.1081
415 Wharncliffe Road South
London, ON, N6J 2M3