
Update to the OSFI New Mortgage Rule Changes Effective January 1, 2018
The Qualifying Rate for all Conventional/ Uninsured Mortgages:
•The Highest contract rate + 2%
Or
•The Bank of Canada benchmark rate
For all High Ratio Applications, qualification will remains unchanged, the greater of the Contract Rate or Bank of Canada Benchmark Rate currently at 4.99%.
Purchases approved prior to January 1, 2018 will be honoured based on the old rules provided there is no change in the property and/or borrowers
If there is a legally binding Purchase and Sale Agreement that is dated prior to January 1, 2018, regardless of closing date, the customer will qualify under the old lending rules
Pre-approvals: if they are not converted into property specific deal before January 1, 2018, they will no longer be valid under old rules and need to be re-qualified under the new lending rules.
Refinances approved before January 1, 2018 must close within 120 days of the application dateto qualify under the old rules.
Market Commentary
London LSTAR stats released for October 2017. The London and St. Thomas Association of REALTORS® (LSTAR) announced 757 homes exchanged hands last month, slightly down 10.2% from the same time a year ago. Year-to-date sales are up 10.6%, with a total of 10,111 homes sold, marking the second consecutive year residential sales have surpassed 10,000 across the region.
In October, the average sales price across London and St. Thomas was $325,331 up 14.2% from the same time a year ago. The average year-to-date sales price was $330,497 up 18.3% from October 2016.
“When looking at the region, home sales in London East, London South and London North have posted healthy gains in year-to-date activity,” Smith said. “In London East, home sales are up 21.2% compared to a year ago, while in London South, sales are up 13.9% and in London North, sales are up 6.5% compared to this time last year.”
In October, there were 847 listings, down 17% from the same time in 2016. St. Thomas saw a total of 67 homes sold, down 21.2% from the same time last year. The average home price in St. Thomas was $284,344 up 25.7% from October 2016.
Complete details can be found here: http://www.lstar.ca/market-updates .
While Vancouver and Toronto produce home sales and price numbers that seem to show they are shrugging-off government attempts to cool them, Montreal has quietly become one to watch.
Home sales in Montreal jumped 7% in October led by a 13% increase in condo sales. Single-family detached homes saw a 3% increase. Prices rose 9.2%. Homes in the region remain a relative bargain though, with an average price of $387,000. Toronto saw a 2.3% increase to $780,000. Vancouver climbed 12.4% to $1.1 million.
Homes are selling more quickly in Montreal. Singles were on the market for an average of 78 days, almost two weeks shorter than a year ago. “Plexs” (2 to 5 units) spent an average of 81 days on the market, three days shorter than last October. Condos continue to have the longest hang time, 103 days. But that is 17 days faster than last year.
Strong job creation, consumer confidence and immigration get the credit, but upcoming changes in mortgage qualification rules have likely played a role in moving buyers off the sidelines. By First National Financial.
Market Showing Signs of Rebounding
October sales indicate the housing market is bouncing back, and the Greater Toronto and Vancouver areas are leading the way.
Sales last month were up 0.9% over September, even though listings declined 0.8%, which is in stark contrast to the August-to-September increase of 5%.
The Canadian Real Estate Association compiled the data, and another key finding was that October’s sales-to-new-listings ratio of 56.7% was up 1% from September, indicating the market is balancing.
Year-over-year sales in October decreased 4.3%, but the national average sale price of $505,937 was up 5%. However, the average sale price dropped to $383,000 when the GTA and GVA were removed from the equation.
REMAX Integra CEO Pamela Alexander says inventory is still tight in Canada’s two largest housing markets, but that signifies a return to a stable and predictable market. Fortunately, she says, it will be nothing like the beginning of 2016, when there was unusually high activity and homes sold well over value.
“It looks like it’s heading back to a normal market, like the one we’ve been experiencing for the last 10 years,” she said. “The market is trying to find its balance across the country, especially in its two biggest markets.”
Looking ahead through the remainder of 2017 and into next year’s first quarter, Alexander expects stable and healthy price growth, which she pegs in the five to 10% range, in accordance with robust market fundamentals, like immigration, strong employment and end-user consumer mentality.
However, inventory is below normal levels and will stay that way for the foreseeable future.
“Inventory is tightening up a little bit, but there’s still a bit more inventory than there was through the beginning of 2016,” she said. “We believe inventory will remain pretty tight. Right now we’re at two month’s supply, approximately, which is pretty tight by international standards. Inventory will continue to be in demand, and many markets are going to be driven by demand.”
Alexander doesn’t expect the B20 rule changes to have a major impact on the market, either. She believes consumers will adjust to the new rules, as they always do, and that the market always finds a way to adjust to the needs of supply and demand. As an example, she cited the land transfer tax, which is largely considered the price of doing business now in Toronto.
“There is still going to be price appreciation at the beginning of 2018, even with the mortgage rules,” said Alexander. “People are going to have to adjust to the new rules, but I think they’re going to do so. The stress test is giving people opportunities also to extend amortization periods, to offer variable rate mortgages—there are a lot of products out there and the banks don’t seem overly concerned. It will be a little bit different, but I believe that consumers will find a way to make it work.” By The Canadian Press.
Economic Highlights:
United States
· With little to digest on the data front, significant attention was devoted to political developments this week. Stock markets remained upbeat through Wednesday, given optimistic expectations on tax reform, supportive earnings reports and gains among energy stocks.
· However, market sentiment turned down thereafter, as developments on tax reform failed to meet expectations, given key differences between the House bill and the newly-released Senate bill.
· While tax reform will remain top of mind in the days ahead, a number of important data releases next week will help tilt the narrative back toward economic fundamentals, with emphasis placed on the upcoming CPI report.
Canada
· The WTI crude oil benchmark jumped to over $57 per barrel, reaching the highest level seen since mid-2015.
· In a speech this week, Governor Poloz maintained a dovish tone, focusing on the softness in inflation. Further rate hikes remain highly data dependent.
· Housing starts increased in October, erasing some of September’s decline. However, with higher interest rates and new B20 measures weighing on demand, starts are likely to gradually slide in the coming quarters.

Rates
We have seen a some lenders come out with more competitive high ratio insured 4 and 5 year fixed rates int the past week. We pride ourselves in originating the best available deals and lowest rates for our clients for any term or rate type.

Other Newsworthy
Housing is No Longer a Canadian Growth Leader
OSFI has announced steps to reduce risks in the uninsured mortgage space. Siddall pointed out that these measures apply only to the federally-regulated financial institutions. He is concerned about the increasing levels of riskier mortgage activity by non-federally-regulated financial institutions.
The measures introduced by the federal government in October of last year to tighten insured mortgage lending qualifications mainly by stress-testing applicants at the 5-year posted mortgage rate, rather than the contract rate, has slowed insured mortgage lending volumes by 25%, which is in line with CMHC expectations. Average property selling prices have fallen commensurately as well.
But with so much attention paid to the imprudent borrower, I think it is important to note that the vast majority of Canadians manage their finances in a responsible manner. For example, roughly 40% of homeowners are mortgage-free and one-third of all households are totally debt-free. Another 25% of households have less than $25,000 in debt, so 58% of Canadian households are nearly debt free. Hence, mortgage delinquency rates are extremely low. In addition, two-thirds of outstanding mortgages are fixed rate, which mitigates the risk of rising mortgage rates over the near term.
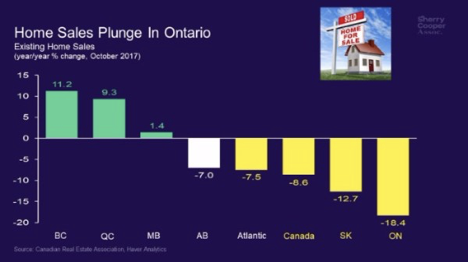
So here we are in the lead-up to the January 1, 2018 implementation of the new OSFI B-20 regulations requiring that uninsured borrowers be stress-tested at a mortgage rate 200 basis points above the contract rate. It has been widely expected that home sales would jump before yearend in advance of the new ruling and indeed they have. Even so, activity remains well below peak levels earlier this year and prices continue to fall in the Greater Toronto Area (GTA) for the sixth consecutive month. Indeed, national home sales were down 8.6% year-over-year in October, led by a whopping 18.4% plunge in Ontario (see chart below).
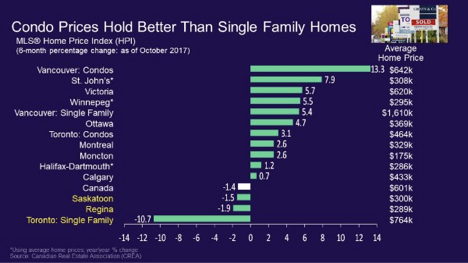
Toronto single-family house prices were down 10.7% over the past six months ending October 31 (see chart below). GTA condo prices have fared better, up 2.6% since late April, but the rise is minuscule in comparison to the booming price gains evidenced before the Ontario government’s ‘Fair Housing Plan’ that introduced, among other things, a 15% tax on non-resident foreign purchases of homes.
According to statistics released today by the Canadian Real Estate Association (CREA), national home sales rose 0.9% from September to October–the third such monthly uptick–but remained almost 11% below the record set in March. Activity in October was up from the previous month in about half of all local markets, led by the Greater Toronto Area (GTA) and the Fraser Valley, together with some housing markets in the Greater Golden Horseshoe region.
On a year-over-year basis, sales were down 4.3% last month, extending the year-over-year declines to seven consecutive months. The decrease in sales from year-ago levels occurred in slightly more than half of all local markets, led overwhelmingly by the GTA and nearby cities.
“Newly introduced mortgage regulations mean that starting January 1st, all home buyers applying for a new mortgage will need to pass a stress test to qualify for mortgage financing,” said CREA President Andrew Peck. “This will likely influence some home buyers to purchase before the stress test comes into effect, especially in Canada’s pricier housing markets.”
“National sales momentum is positive heading toward year-end,” said Gregory Klump, CREA’s Chief Economist. “It remains to be seen whether that momentum can continue once the recently announced stress test takes effect beginning on New Year’s day. The stress test is designed to curtail growth in mortgage debt. If it works as intended, Canadian economic growth may slow by more than currently expected.”
Balanced Markets Though New Listings Fall
The number of newly listed homes eased by 0.8% in October following a jump of more than 5% in September. The national result was influenced most by declines in new supply in London-St. Thomas, Calgary and Greater Vancouver.
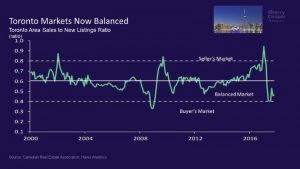
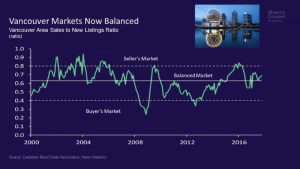
With sales up slightly and new listings having eased, the national sales-to-new listings ratio rose to 56.7% in October from 55.7% in September. A national sales-to-new listings ratio of between 40% and 60% is consistent with a balanced national housing market, with readings below and above this range indicating buyers’ and sellers’ markets respectively. According to the sales-to-new listings measure, housing markets in both Toronto and Vancouver remain balanced. As the charts below show, the Toronto market shifted dramatically from a seller’s market following the April provincial housing measures.
The number of months of inventory is another measure of the balance between housing market supply and demand, representing how long it would take to liquidate current stocks of unsold homes at the current rate of sales activity. There were five months of inventory on a national basis at the end of October, unchanged from the previous two months and roughly at par with the long-term average.
In the Greater Golden Horseshoe region including and surrounding Toronto, the number of months of inventory was 2.5 months, up sharply from the all-time low of 0.8 months in February and March. However, it remains below the region’s long-term average of 3.1 months.
Price Gains Diminish Nationally
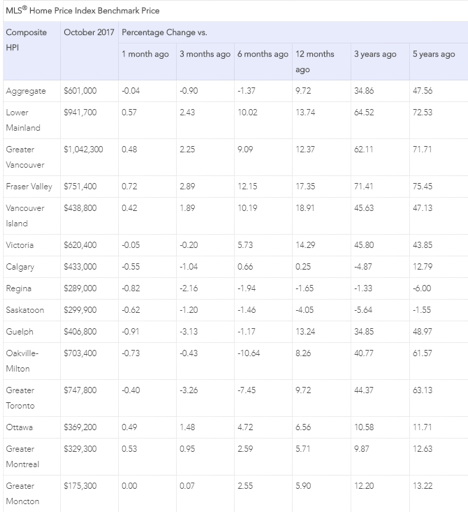
Price appreciation continued to moderate year-over-year. The Aggregate Composite MLS® Home Price Index (HPI) rose by 9.7% year-over-year (y-o-y) in October 2017, representing a further deceleration in y-o-y gains since April and the smallest increase since March 2016. The slowdown in price gains mainly reflects softening price trends in Greater Golden Horseshoe housing markets tracked by the index. Price appreciation was strongest in condos and weakest in single-family benchmark homes, which continues the trend in place since May 2017.
In October, apartment units again posted the most substantial y-o-y gains (+19.7%), followed by townhouse/row units (+13.2%), one-storey single family homes (+6.3%), and two-storey single family homes (+5.8%). The price appreciation in single-family homes was at its lowest level since March 2015.
The MLS® Home Price Index provides the best way of gauging price trends because average price trends are prone to be strongly distorted by changes in the mix of sales activity from one month to the next.
By Dr. Sherry Cooper. Chief Economist. Dominion Lending Centres.

|
| Terms |
Posted
Rates |
Payment
Per $100k |
Our Rates |
Payment
Per $100k |
Savings |
| 6 Months |
3.14% |
$480.46 |
3.10% |
$478.39 |
$2.07 |
| 1 Year |
3.04% |
$475.30 |
2.89% |
$467.62 |
$7.68 |
| 2 Years |
3.24% |
$485.65 |
2.54% |
$449.96 |
$35.68 |
| 3 Years |
3.44% |
$496.11 |
2.89% |
$467.62 |
$28.49 |
| 4 Years |
3.89% |
$520.07 |
2.89% |
$467.62 |
$52.45 |
| 5 Years |
4.99% |
$581.04 |
2.94% |
$470.17 |
$110.86 |
| 7 Years |
5.30% |
$598.80 |
3.69% |
$509.35 |
$89.45 |
| 10 Years |
6.10% |
$645.76 |
3.74% |
$512.02 |
$133.74 |
| Variable |
2.70% |
$457.99 |
2.21% |
$433.65 |
$24.33 |
| Prime Rate |
3.20% |
|
|
|
|
Please Note: Payment per $100K and possible savings shown above are based on a 25-year ammortization. Rates are subject to change without notice and the rate you receive may vary depending on your personal financial situation. *OAC E&OE. Please reply to this email and I will be happy to provide you with greater detail and determine the best rate available for you.
This edition of the Weekly Rate Minder shows the latest rates available for Canadian mortgages. At Dominion Lending Centres, we work on your behalf to find the best possible mortgage to suit your needs.
- We are Canada’s largest and fastest-growing mortgage brokerage!
- We have more than 2,600 Mortgage Professionals from more than 350 locations across the country!
- Our Mortgage Professionals are Experts in their field and many are ranked among the best nationally.
- We work for you, not the lenders, so your best interests will always be our number one priority.
- We have more than 100 mortgage programs, making it easy to choose the best fit for your unique situation.
- We close loans in all 10 provinces and 3 territories.
- We can process your mortgage in as few as 7 days.
- We are the preferred mortgage lender for several of Canada’s top companies.
- Dominion Lending Centres’ Mortgage Professionals are available anytime, anywhere, evenings and weekends – and we’ll even come to you!

![]()


