

Industry & Market Highlights
CMHC
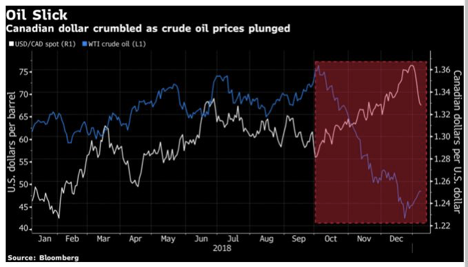
The Bank of Canada left the overnight benchmark policy rate at 1-3/4%, as expected. In another dovish statement, the Bank of Canada acknowledged a slowdown in global economic activity and highlighted that oil prices are roughly 25% lower than what they had assumed in the October Monetary Policy Report (MPR). The lower prices primarily reflected sustained increases in U.S. oil supply and increased worries about global demand, especially in light of a potential U.S.-China trade war (see oil chart below).
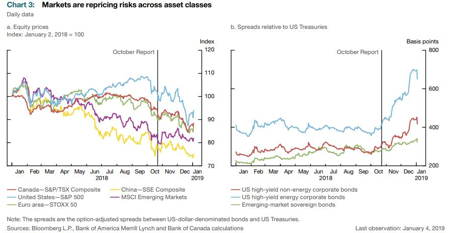
The Bank also commented that these worries had been mirrored in bond and stock markets. Credit spreads off Treasuries have widened, and stock markets have sold off around the world (see chart below). Equity prices and bond yields have declined in the face of market unease over global growth. Volatility has risen, and corporate credit spreads have widened sharply. A tightening of corporate credit conditions is particularly evident in the North American energy sector reflecting the decline in oil prices.
Weak oil prices negatively impact the Canadian economic outlook and “transportation constraints and rising production have combined to push up oil inventories in the west and exert even more downward pressure on Canadian benchmark prices. While price differentials have narrowed in recent weeks following announced mandatory production cuts in Alberta, investment in Canada’s oil sector is projected to weaken further.”
The Bank acknowledged that the economy is running close to potential, unemployment is at a 40-year low and trade will likely improve with the weak dollar, the trade deal with Mexico and the U.S. (now dubbed “CUSMA”) and federal tax measures to target investment. Nevertheless, consumer spending and housing investment “have been weaker than expected as housing markets adjust to to municipal and provincial measures, changes to mortgage guidelines, and higher interest rates. Household spending will be dampened further by slow growth in oil-producing provinces.”
The contribution to average annual real economic growth from housing investment has been revised down to -0.1% this year from the +0.1% forecast in October.
The Bank of Canada revised down its forecast for real GDP growth in 2019 to 1.7%–0.4 percentage points lower than the October outlook. According to the Bank, “This will open up a modest amount of excess capacity, primarily in oil-producing regions. Nevertheless, indicators of demand should start to show renewed momentum in early 2019, leading to above-potential growth of 2.1% in 2020.”
Inflation remains close to 2%, the central bank’s target, having fallen to 1.7% in November, due to lower gasoline prices. While low gasoline prices will depress inflation this year, the weak Canadian dollar will have an offsetting impact on the CPI. On balance, the bank sees inflation returning to around 2% by late this year.
Considering all of these factors, the Governing Council continues to judge that the benchmark policy rate will need to rise over time to a neutral range to achieve the inflation target. “The appropriate pace of rate increases will depend on how the outlook evolves, with a particular focus on developments in oil markets, the Canadian housing market, and global trade policy.”
Bottom Line: The Bank of Canada for the first time admits in today’s MPR that the slowdown in the housing market has been more dramatic than the Bank’s staff had expected. The January MPR states, “provincial and municipal housing market policies, the tighter mortgage finance guidelines and higher mortgage rates continue to weigh on housing activity. Slowing of activity in some markets has been associated with less speculative activity. As a result, it is difficult to evaluate the sensitivity of non-speculative demand to the various policy changes. Monthly indicators have signalled that spending on housing likely contracted again in the fourth quarter. Weaker-than-expected housing activity in recent months and staff analysis suggest that the combined effect of tighter mortgage guidelines and higher interest rates has been larger than previously estimated. The Bank will continue to monitor developments in housing markets to assess how construction is adjusting to the shift in demand toward lower-value units.”
The Bank see less urgency to raise interest rates as the economy copes with slumping oil prices and weak housing markets. The five interest rate hikes since mid-2017 are having a more substantial impact on spending than the Bank expected. A short-term pause in rate hikes is now likely. The economy slowed considerably in the fourth quarter of last year, which will continue in the first quarter of this year owing to the decline in oil prices and the Alberta government’s implemented oil production cuts.
While it is unlikely that the Bank is finished its tightening this cycle, expect rates to remain steady until we see solid evidence of a rebound in the oil sector and in housing as interest-rate sensitivity of Canadians is at historical highs.
Real Estate Statistics for December 2018 London St. Thomas
London and St. Thomas Association of REALTORS® (LSTAR) announced 439 homes* were sold in December, up 2.1% over December 2017 and right on par with the 10-year average. The number of home resales for the year was 9,799, down 13.3% compared to 2017, which set a record year for residential real estate.
“One of the trends that stood out in December was the sales-to-new listings ratio, which was 108.1% across the region,” said Jeff Nethercott, 2018 LSTAR President. “It’s a statistic the Canadian Real Estate Association (CREA) says represents conditions in the marketplace that favour sellers (a ratio between 40% and 60% is generally consistent with a balanced market). In London, the sales-to-new listings ratio was 119.7%, while in St. Thomas it was 100.0%.”
December also saw average home sales price make steady gains in LSTAR’s jurisdiction. In London, the average sales price was $375,782, up 13.4% from last December, while it was $304,079 in St. Thomas, an increase of 0.7% from December 2017.

“Looking at specific areas, London South (which also includes data from the west side of the city) had an average sales price of $421,044 in December, up 16.2% compared to the same period last year and achieving its highest average sales price in the last 10 years,” Nethercott said. “In London North, the average sales price was $426,831, up 16.6% from December 2017, while in London East it was $284,100, up 7.0% compared to last December.”
“Overall, it was a very solid year for home resales in London and St. Thomas,” Nethercott said. “The activity in 2018 performed well above the 10-year average, despite the record low inventory levels seen in the marketplace the entire year. As we kick off 2019, I believe home sales will continue to be strong and be a driving force to the local economy.”
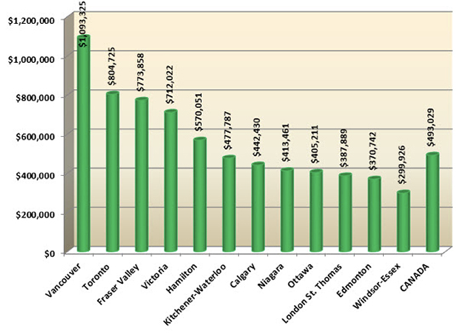
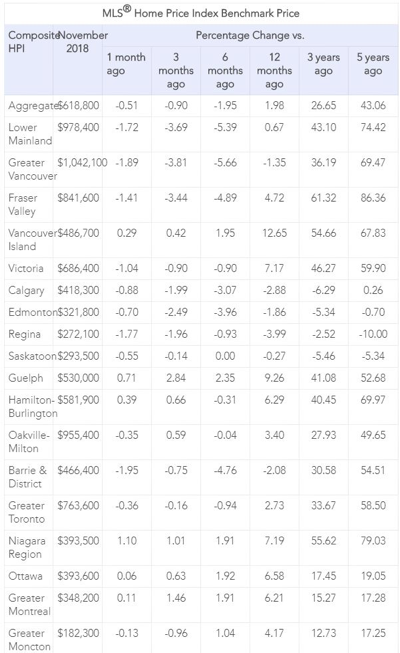
The following chart is based on data taken from the CREA National MLS® Report for November 2018 (the latest CREA statistics available). It provides a snapshot of how average home prices in London and St. Thomas compare to other major Ontario and Canadian centres.
By The London and St. Thomas Association of REALTORS® (LSTAR).
CMHC
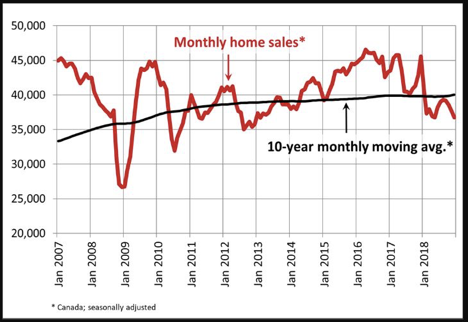
Statistics released by the Canadian Real Estate Association (CREA) show that national home sales dipped for the fourth consecutive month, down 2.5% from November to December, capping the weakest annual sales since 2012. According to last week’s Bank of Canada Monetary Policy Report, housing activity in Canada has fallen by more than the Bank’s economists had expected owing to tighter mortgage-qualification restrictions and rising interest rates.
Monthly declines in home sales since September have fully reversed their summer rally and returned monthly sales to near their lowest level since early 2013.
Transactions declined in about 60% of all local markets in December, led by lower activity in Greater Vancouver, Vancouver Island, Ottawa, London & St. Thomas, and Halifax-Dartmouth, together with a regionally diverse mix of other large and medium-sized urban centres.
On a not seasonally adjusted basis, actual activity was down 19% year-over-year in December 2018 and stood almost 12% below the ten-year average for the month. Sales were down from year-ago levels in three-quarters of all local markets, led overwhelmingly by the Lower Mainland of British Columbia, the Okanagan Region, Calgary, Edmonton, the Greater Toronto Area and Hamilton-Burlington. Sales had been boosted in December 2017 by homebuyers rushing to purchase before the new federal mortgage stress test took effect at the beginnng of this year.
The Bank of Canada forecasts that the housing market will remain soft this year, undermining economic growth as the mortgage stress test has rendered housing unaffordable for many potential homebuyers.
New Listings
The number of newly listed homes remained little changed (+0.2%) from November to December, with declines in close to half of all local markets offset by gains in the remainder.
With sales down and new listings steady in December, the national sales-to-new listings ratio eased to 53.3% compared to 54.8% in November. This measure of market balance has remained close to its long-term average of 53.5% since the beginning of 2018.
Based on a comparison of the sales-to-new listings ratio with the long-term average, about two-thirds of all local markets were in balanced market territory in December 2018.
There were 5.6 months of inventory on a national basis at the end of December 2018. While this remains close to its long-term average of 5.3 months, the number of months of inventory has swollen far above its long-term average in Prairie provinces as well as in Newfoundland & Labrador. By contrast, the measure remains well below its long-term average in Ontario and Prince Edward Island. In other provinces, sales and inventory are more balanced.
Home Prices
The Aggregate Composite MLS® Home Price Index (MLS® HPI) was up 1.6% y/y in December 2018. The increase is smaller but still broadly in line with y/y gains posted since July.
Following a well-established pattern, condo apartment units posted the largest y/y price gains in December (+4.9%), followed by townhouse/row units (+3.1%). By comparison, two-storey single-family homes posted a small increase (+0.4%) while one-storey single-family home prices eased slightly (-0.3%).
Trends continue to vary widely among the 17 housing markets tracked by the MLS® HPI. Results were mixed in British Columbia. Prices are now down on a y/y basis in Greater Vancouver (-2.7%) but remain above year-ago levels in the Fraser Valley (+2.5%). Meanwhile, prices posted a y/y increase of 6.4% in Victoria and rose 11% elsewhere on Vancouver Island.
Among housing markets tracked by the index in the Greater Golden Horseshoe region, MLS® HPI benchmark home prices were up from year-ago levels in Guelph (+6.8%), the Niagara Region (+6.8%), Hamilton-Burlington (+6.4%), Oakville-Milton (+3.3%) and the GTA (+3%). Home prices in Barrie and District remain slightly below year-ago levels (-1.1%).
Across the Prairies where supply is historically elevated relative to sales, benchmark home prices remained below year-ago levels in Calgary (-3.2%), Edmonton (-2%), Regina (-5.2%) and Saskatoon (-1.2%). The home pricing environment is likely to remain weak in these housing markets until elevated supply reflective of the weak oil market is reduced and becomes more balanced in relation to demand.
Home prices rose 6.9% y/y in Ottawa (led by an 8.3% increase in townhouse/row unit prices), 6% in Greater Montreal (driven by a 9.1% increase in townhouse/row unit prices) and 2.5% in Greater Moncton (led by a 12.2% increase in townhouse/row unit prices). (Table 1, unfortunately, CREA did not update the table with December data as of this writing).
Bottom Line
We are likely in store for a prolonged period of modest housing gains in the Greater Golden Horseshoe, stability or softening in British Columbia and further weakening in the Prairies, Alberta, and Newfoundland & Labrador.
Sluggish sales and modestly rising prices nationally are likely in store for 2019. While there will still be some significant regional divergences, there is no need for further policy actions to affect demand.
By Dr. Sherry Cooper. Chief Economist, Dominion Lending Centres
Economic Highlights

Canadian Jobs Market Remains Tight in December, but Wage Growth Disappoints
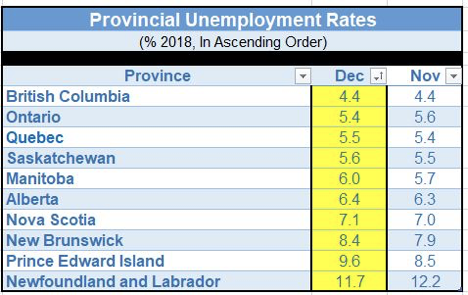
Statistics Canada released its December Labour Force Survey this morning showing modest job gains and an unemployment rate that remains at a record-low 5.6%. The economy generated 9,300 net new jobs in December, a small increase following a record 94,100 jump in the prior month. However, December’s rise beat economists’ expectations of 5,500 jobs and a jobless rate of 5.7%. All of the tepid increase last month was in part-time and self-employment, a general sign of weakness. Full-time work fell in December for the first time in three months, and wages remained sluggish.
In December, employment rose in Newfoundland and Labrador, while it fell in Alberta, New Brunswick and Prince Edward Island. There was little change in net new jobs in other provinces.
Increases were recorded in manufacturing, transportation and warehousing, as well as in health care and social assistance. There were job losses in wholesale and retail trade, especially in Ontario.
For all of 2018, the economy added 163,300 jobs, all of them full-time, for a 0.9% rise representing a significant slowdown from the pace of job growth in 2017 when the economy was much stronger. In 2017, the economy grew at a 3% rate–the strongest in the G7–compared to only about 2% last year. Employment rose by an out-sized 427,300 in 2017 and has average annualized gains of 225,000 workers since 2010.
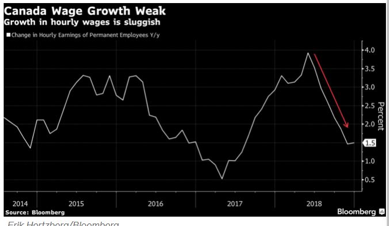
With the unemployment rate falling to its lowest level since comparable data collection began in January 1976, it is not surprising that labour shortages are emerging and businesses are having trouble filling job openings. What is surprising is the tepid pace of wage growth. Even with the very tight labour market, December’s wage growth reading was a weak 1.49% annual rate, well below the inflation rate (see chart below). Year-over-year average hourly wage growth for permanent workers was only 1.46%, decelerating steadily since its May peak of 3.9%.
In direct contrast, today’s release of nonfarm payroll data in the U.S. for December showed a stellar 312,000 job gain, and average hourly pay improved 3.2% from a year ago–well above the inflation rate–and up from average wage growth of 2.7% at the end of 2017.
December Housing Reports Show Plummeting Home Sales in 2018 in Toronto and Vancouver
In separate releases, the local real estate boards in Canada’s largest housing markets released data this week showing home sales fell to decade lows in 2018 reflecting rising interest rates and stricter mortgage rules.
Sales in the GTA fell 16% in 2018 while the average price declined 4.3%, the Toronto Real Estate Board reported today. That is the worst year for sales in Canada’s largest city since the financial crisis in 2008. In Vancouver, full-year sales fell 32%, the lowest since 2000 and 25% below the 10-year average. Prices in Vancouver for detached homes in some areas dropped at least 10%.
Sales in both cities dived in the first half of 2018 after the federal government imposed more stringent qualifying rules for mortgages. Vancouver sales continued to suffer even while Toronto began to recover in the second half, as the British Columbia government introduced more measures to deter speculation. The BC government in its 2018 budget increased the foreign buyers’ tax and added a speculation tax, which in addition to rising interest rates dampened sales, especially for more expensive single-family homes.
New listings were down in Toronto last month as homeowners have decided to stay put for now rather than attempting to cash out. By Dr. Sherry Cooper. Chief Economist, Dominion Lending Centres
Mortgage Interest Rates
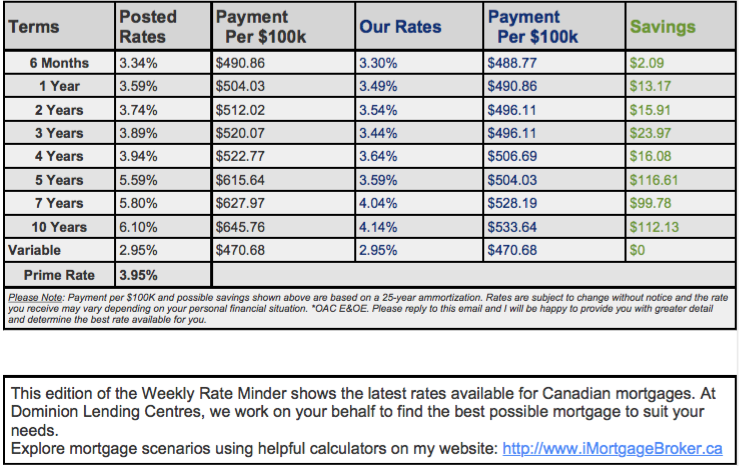
Prime lending rate is 3.95%. Bank of Canada Benchmark Qualifying rate for mortgage approval remains at 5.34%. Fixed rates are on hold. A few lenders are brining out special promotional lower fixed rates to try and increase market share. Deep discounts are offered by some lenders for variable rates making adjustable variable rate mortgages very attractive.

Other Industry News & Insights
Roundup of the latest mortgage and housing news.
From Mortgage Professionals Canada.
- 3 reasons high household debt in Canada won’t contribute to a US-style housing crash (Livabl)
- The number one reason BC home sales nosedived in 2018, according to the province’s realtors (Livabl)
- Ont. legislators quietly hike housing allowance by 20% as Toronto rental rates jump (BNN Bloomberg)
- Canada’s commercial property market is set for another blockbuster year (Vancouver Sun)
- Burst housing bubble in 2019? Don’t bet on it, B.C. developers predict (Vancouver Sun)
- Vancouver Becomes the Weak Link in Canada’s Housing Slowdown (Bloomberg)
- One quarter of Canadian HELOC users pay interest only: Survey (BNN Bloomberg)
- Where are Canadian mortgage rates headed in 2019? Experts weigh in (Livabl)
- The drop in 2018 Canadian home prices isn’t what it seems (Livabl)
- Rents Rise By Double Digits In 17 Of 24 Canadian Cities: Padmapper (Huffington Post)
- Canada’s Housing Markets End 2018 With A Thud Amid ‘Sharp Slowdown’ Worldwide (Huffington Post)
- One quarter of Canadian HELOC users pay interest only: Survey (BNN Bloomberg)
- Canadians weighed down by lines of credit they don’t understand (CBC)
- Canadian home prices post biggest decline since 1995. So what’s next? (Livabl)
- Home prices in this Canadian city poised to grow by 10% in 2019 (Livabl)
- “No more detached homes for you,” economist tells Canada (Livabl)
- When It Comes to Rates, What Are Central Banks Going to Do Next? (Bloomberg)
- Canadian House Prices To Drop As ‘Huge’ Wave Of New Homes Arrives: Report (Huffington Post)
- Affordable Housing Problem Is Causing Vancouver’s Brain Drain: Minister Carole James (Huffington Post)
- This BC city just saw its biggest homebuilding boom since 1976 — will it continue this year? (Livabl)
- New condo sales are still surging in these Canadian housing markets (Livabl)
- A soft landing for Toronto’s housing market? This expert thinks so (Livabl)
- Canadians Pessimistic About Finances and Economy (Canadian Mortgage Trends)
- Toronto Rents Poised to Ease in 2019 After Last Year’s Surge (Bloomberg)
- Housing starts down in December, CMHC report (CBC)
- Mortgage growth will be low or flat this year: CIBC CEO (CBC)
- Where’s the Canadian luxury real estate market headed in 2019? (Livabl)
- A bad sign for indebted Canadians is emerging as bankruptcies continue to rise (Livabl)
- First- and Second-Home Buyers Can Expect Discounts in 2019 (Bloomberg)
- The Winners and Losers of Canada’s Luxury Home Market in 2019 (Bloomberg)
- Mortgage growth to be flat to low-single digit in 2019: CIBC’s Dodig (BNN Bloomberg)
- The downside of Canada’s homebuilding boom to be felt in the coming years: report (Livabl)
- Commercial Real Estate: Commercial property values rise 18 per cent in past year: B.C. Assessment (Vancouver Sun)
- The housing bear who predicted the 2018 slowdown says the worst is yet to come (Vancouver Sun)
- Mortgage stress test takes a toll on Toronto renters, too (Livabl)
- What would it take for Canadian interest rates to drop in 2019? (Livabl)
- Housing affordability to worsen in 2019 even as market cools, says RBC (CBC)
- GTA home sales drop 16% in 2018, fewer houses listed: TREB (CBC)
- Calgary housing market takes a hit as oilpatch job losses return (Calgary Herald)
- It’s Not Just Toronto And Vancouver: A Synchronized Global Housing Downturn Is Here (Huffington Post)
- The problem with the Canadian government’s mortgage stress test (Livabl)
- Vancouver home sales collapsed to near-20-year low in 2018 (Livabl)
- Final results are in: 2018 was an uneven but not completely terrible year for the Toronto housing market (Livabl)
- Toronto, Vancouver housing sales plummet to decade-lows in 2018 (BNN Bloomberg)
- Why 2019 could be one of Toronto renters’ toughest years yet (BNN Bloomberg)
There is never a better time than now for a free mortgage check-up. It makes sense to revisit your mortgage and ensure it still meets your needs and performs optimally. Perhaps you’ve been thinking about refinancing to consolidate debt, purchasing a rental or vacation property, or simply want to know you have the best deal? Whatever your needs, we can evaluate your situation and help you determine what’s the right and best mortgage for you.
Adriaan Driessen
Mortgage Broker
Dominion Lending Forest City Funding 10671
Cell: 519.777.9374
Fax: 519.518.1081
415 Wharncliffe Road South
London, ON, N6J 2M3
Lori Richards Kovac
Mortgage Agent & Administrator
Dominion Lending Forest City Funding 10671
Cell: 519.852.7116
Fax: 519.518.1081
415 Wharncliffe Road South
London, ON, N6J 2M3
Adriaan Driessen
Sales Representative & Senior Partner
PC275 Realty Brokerage
Cell: 519.777.9374
Fax: 519.518.1081
415 Wharncliffe Road South
London, ON, N6J 2M3
By Dr. Sherry Cooper. Chief Economist, Dominion Lending Centres