
Industry & Market Highlights
Minister Morneau Announces New Benchmark Rate for Qualifying For Insured Mortgages
The new qualifying rate will be the mortgage contract rate or a newly created benchmark very close to it plus 200 basis points, in either case. The News Release from the Department of Finance Canada states, “the Government of Canada has introduced measures to help more Canadians achieve their housing needs while also taking measured actions to contain risks in the housing market. A stable and healthy housing market is part of a strong economy, which is vital to building and supporting a strong middle class.”
These changes will come into effect on April 6, 2020. The new benchmark rate will be the weekly median 5-year fixed insured mortgage rate from mortgage insurance applications, plus 2%.
This follows a recent review by federal financial agencies, which concluded that the minimum qualifying rate should be more dynamic to reflect the evolution of market conditions better. Overall, the review concluded that the mortgage stress test is working to ensure that home buyers are able to afford their homes even if interest rates rise, incomes change, or families are faced with unforeseen expenses.
This adjustment to the stress test will allow it to be more representative of the mortgage rates offered by lenders and more responsive to market conditions.
The Office of the Superintendent of Financial Institutions (OSFI) also announced today that it is considering the same new benchmark rate to determine the minimum qualifying rate for uninsured mortgages.
The existing qualification rule, which was introduced in 2016 for insured mortgages and in 2018 for uninsured mortgages, wasn’t responsive enough to the recent drop in lending interest rates — effectively making the stress test too tight. The earlier rule established the big-six bank posted rate plus 2 percentage points as the qualifying rate. Banks have increasingly held back from adjusting their posted rates when 5-year market yields moved downward. With rates falling sharply in recent weeks, especially since the coronavirus scare, the gap between posted and contract mortgage rates has widened even more than what was already evident in the past two years.
This move, effective April 6, should reduce the qualifying rate by about 30 basis points if contract rates remain at roughly today’s levels. According to a Department of Finance official, “As of February 18, 2020, based on the weekly median 5-year fixed insured mortgage rate from insured mortgage applications received by the Canada Mortgage and Housing Corporation, the new benchmark rate would be roughly 4.89%.” That’s 30 basis points less than today’s benchmark rate of 5.19%.
The Bank of Canada will calculate this new benchmark weekly, based on actual rates from mortgage insurance applications, as underwritten by Canada’s three default insurers.
OSFI confirmed today that it, too, is considering the new benchmark rate for its minimum stress test rate on uninsured mortgages (mortgages with at least 20% equity).
“The proposed new benchmark for uninsured mortgages is based on rates from mortgage applications submitted by a wide variety of lenders, which makes it more representative of both the broader market and fluctuations in actual contract rates,” OSFI said in its release.
“In addition to introducing a more accurate floor, OSFI’s proposal maintains cohesion between the benchmarks used to qualify both uninsured and insured mortgages.” (Thank goodness, as the last thing the mortgage market needs is more complexity.)
The new rules will certainly add to what was already likely to be a buoyant spring housing market. While it might boost buying power by just 3% (depending on what the new benchmark turns out to be on April 6), the psychological boost will be positive. Homebuyers—particularly first-time buyers—are already worried about affordability, given the double-digit gains of the last 12 months. By Dr. Sherry Cooper. Chief Economist, Dominion Lending Centres.
OSFI considering new benchmark rate for uninsured mortgages
The Office of the Superintendent of Financial Institutions (OSFI) has announced that it is considering a new benchmark rate to determine the minimum qualifying rate for uninsured mortgages. OSFI is seeking input from interested stakeholders on this proposal before March 17, 2020.
OSFI’s mortgage underwriting guideline (B-20) sets the minimum qualifying rate for uninsured mortgages. Currently, the minimum qualifying rate is the higher of the contractual mortgage rate plus two percent, or the 5-year benchmark rate published by the Bank of Canada. The current benchmark rate is based on the posted rates from the six largest banks in Canada.
Earlier this year in remarks to the C.D. Howe Institute, OSFI indicated that it was reviewing the benchmark rate used for qualifying uninsured mortgages. OSFI has observed that the gap between actual contract rates and the current benchmark rate has widened, suggesting a less responsive floor than originally intended. The goal of the review is to identify a measure that is more accurate and responsive to market changes.
“Sound mortgage underwriting and B-20 contribute to financial stability throughout the economic cycle. Continually reviewing our prudential measures is part of an effective regulatory framework. This proposal aims to address the limitations of the current benchmark rate while preserving the integrity of the overall qualifying rate,” said Ben Gully, assistant superintendent, regulation.
OSFI is considering replacing the current benchmark rate with the weekly median 5-year fixed insured mortgage rate from mortgage insurance applications, plus a two percent buffer. This would be the same benchmark rate that’s going to be used for insured mortgages as of April 6th, as the Minister of Finance announced yesterday, following consultations with OSFI and other federal financial agencies.
OSFI’s proposed new benchmark for uninsured mortgages is based on rates from mortgage applications submitted by a wide variety of lenders, which makes it more representative of both the broader market and fluctuations in actual contract rates. In addition to introducing a more accurate floor, OSFI’s proposal maintains cohesion between the benchmarks used to qualify both uninsured and insured mortgages.
OSFI is seeking input from interested stakeholders on this proposal by email to b.20@osfi-bsif.gc.ca before March 17. OSFI will communicate final amendments to the benchmark rate for uninsured mortgages by April 1, with changes effective on April 6. By Kimberly Greene.
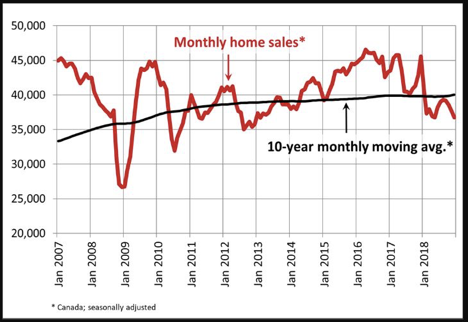
Residential Market Commentary – Tight market to persist
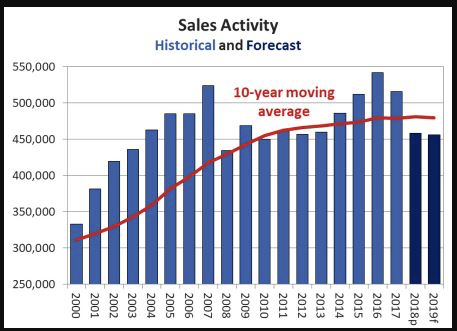
Canada’s re-sale housing market got a little love in January according to statistics released by the Canadian Real Estate Association on Valentine’s Day.
Sales activity was up 11.5% compared to January 2019 and prices climbed by 11.2% from a year ago. It was the best January for sales in 12 years, despite a 2.9% dip from December.
Winter is a notoriously tricky time to gauge the market. Low volumes mean small anomalies or bad weather can have an outsized influence on the numbers. But market watchers, including CREA, are shaking off the month-over-month decline and taking a closer look at other factors.
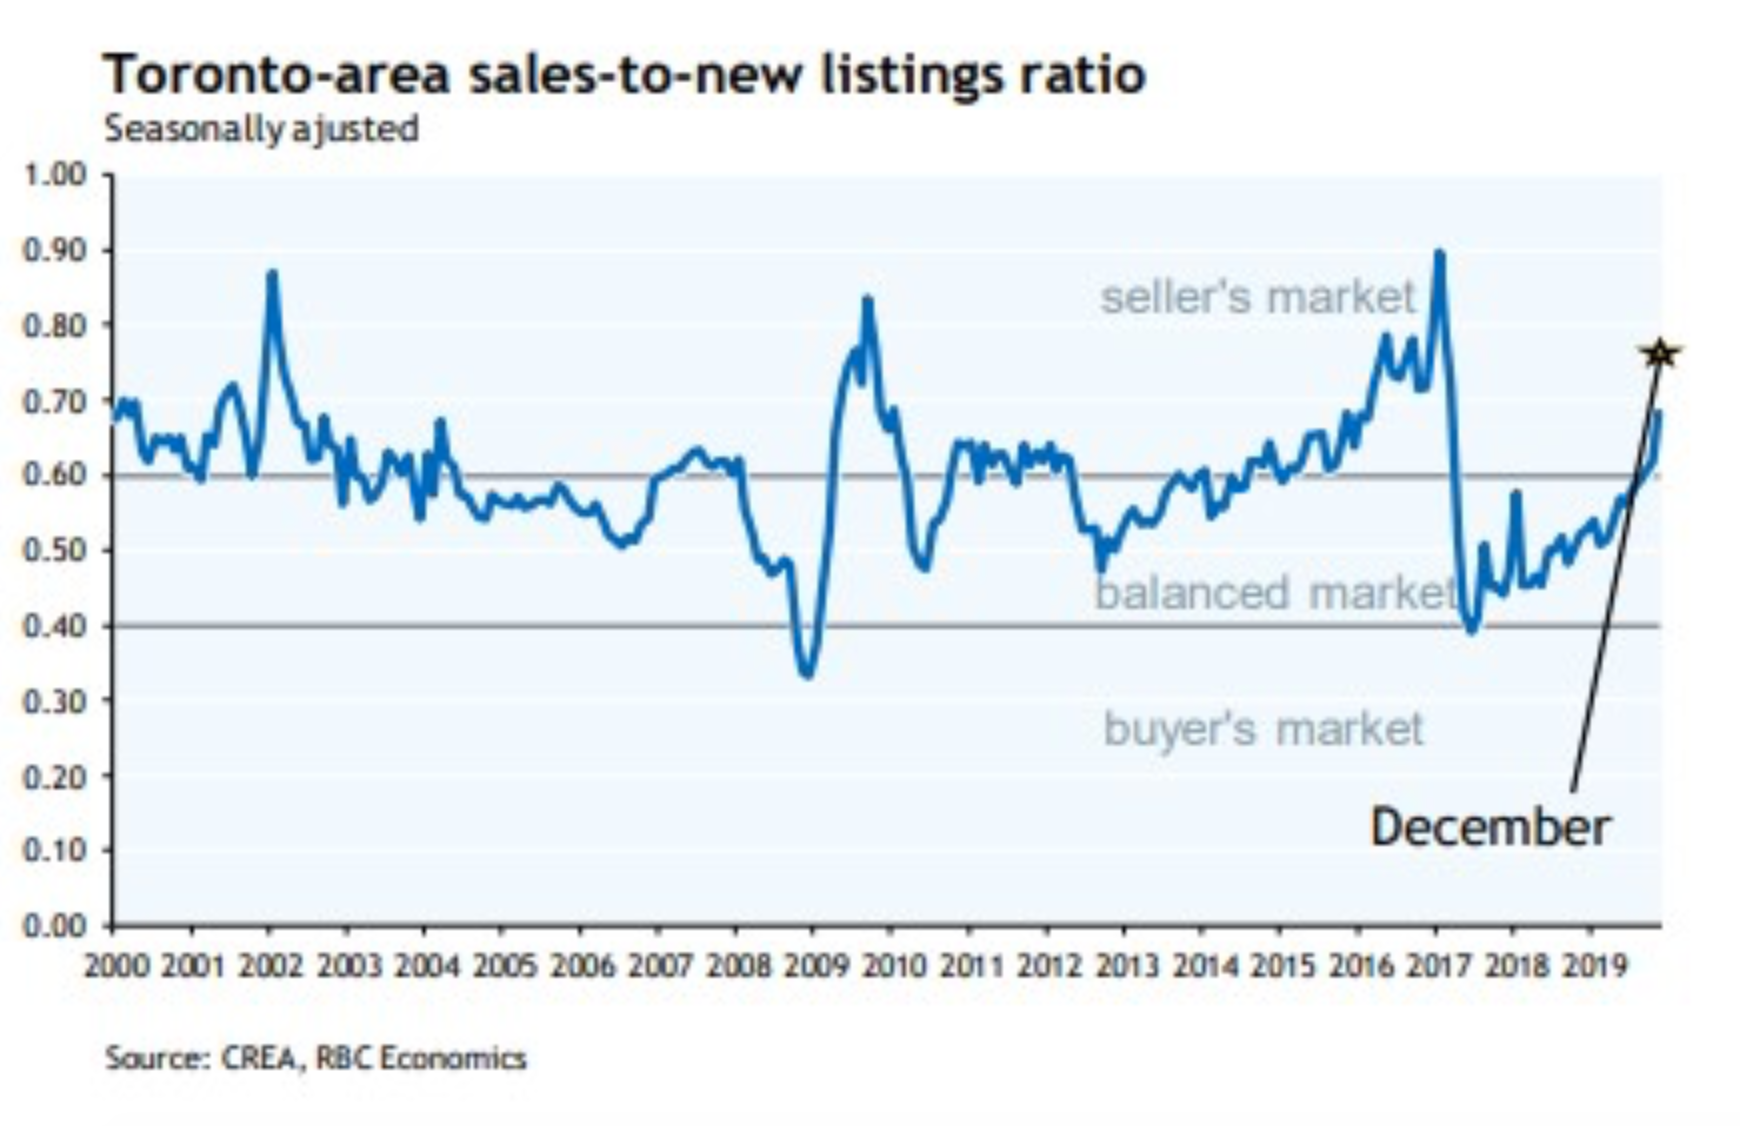
The number of new listings for January was virtually flat; up just 0.2% over December. It’s a very small increase following several months of decline. The sales-to-new-listings ratio is now 65.1%. That is two full points lower than a year earlier, but it is significantly higher than the long-term average of 53.8%, and it has been for the past four months. The national housing inventory is pegged at 4.2 months, a full month below the long-term average.
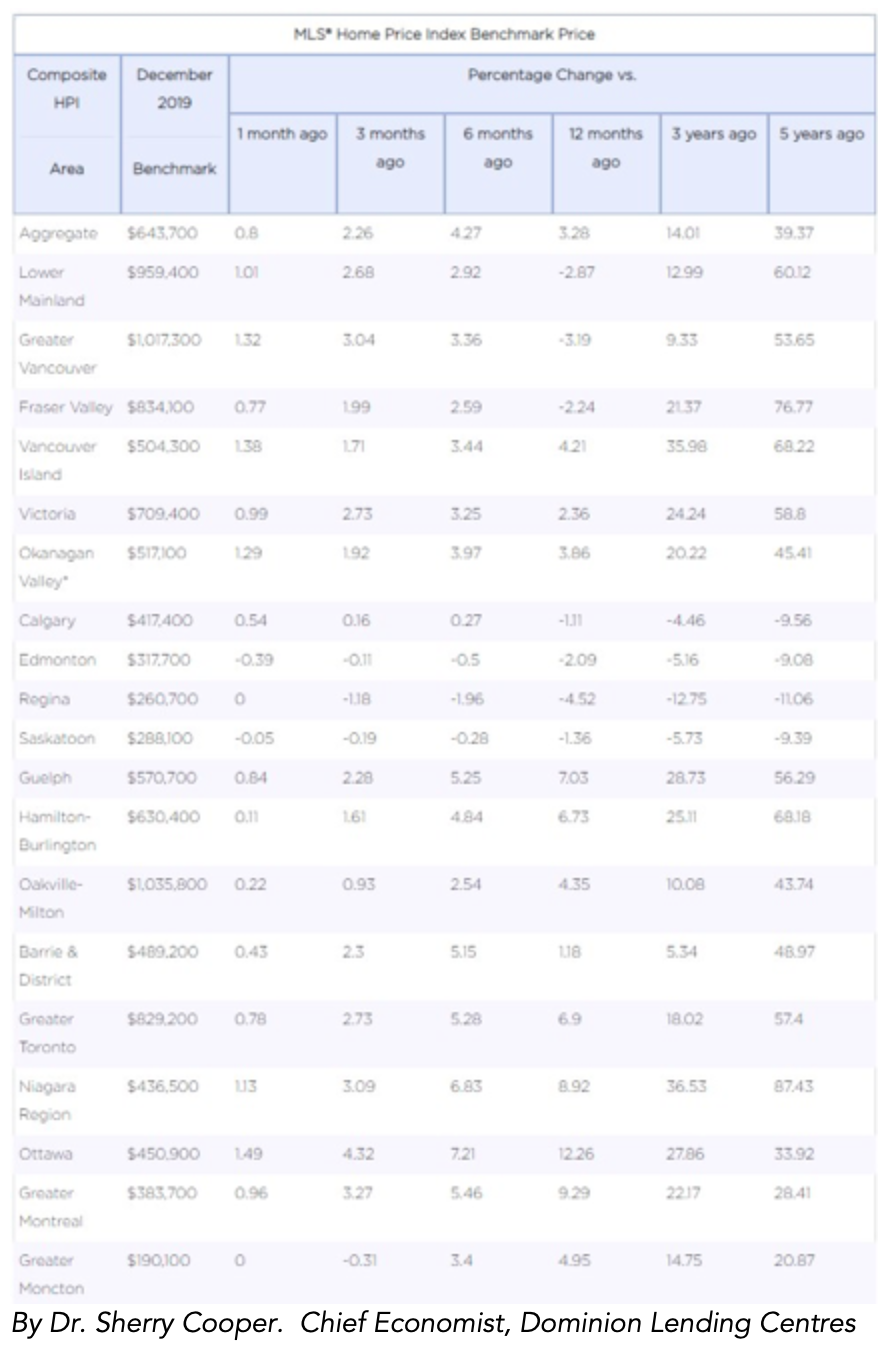
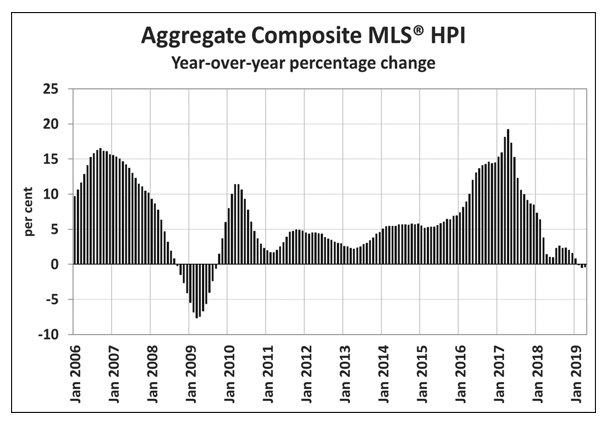
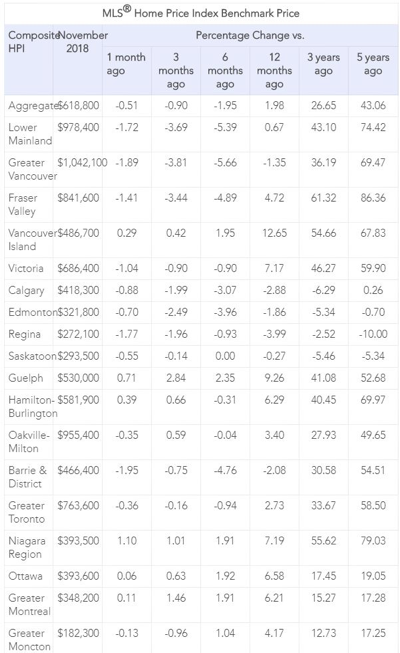
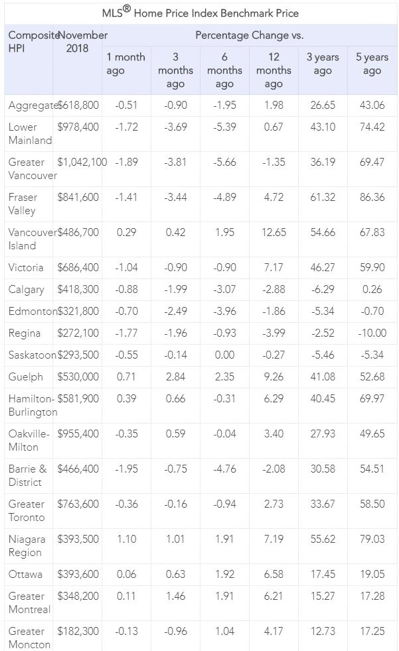
CREA and others expect market tightening to persist and translate into renewed price acceleration. The MLS Home Price Index climbed 4.7% y-o-y in January. Most markets saw increases – several in, or near, double digits – but the prairies and Newfoundland and Labrador are exceptions.
It is also expected that tight market conditions will persist, tilting the balance in favour of sellers. Population growth, wage growth and low unemployment are all factors that promote increasing demand, while supply remains relatively low. By First National Financial.
No. 1 mortgage issue? The stress test
Will the federal government’s current review of the mortgage stress test (Guideline B-20) result in adjustments to the rules, allowing more consumers into the home buying market – particularly in cities and provinces where housing affordability is not a crisis?
Currently the stress test rules keep renters from buying homes in affordable provinces and cities, such as the prairie and Atlantic provinces and in Quebec, says Paul Taylor, CEO and president of Mortgage Professionals Canada. “They (residents) can find properties they can finance quite affordably but they can’t afford the fictitious rate . . . given the distance between the street rate and the stress test. . .”
Reducing the stress test rules could increase buyer activity, but if the federal government thinks a recession is coming – as a number of economists predict – then don’t count on them making significant stress test adjustments, Taylor says.
MPC has wanted a reduction in stress tests almost since the introduction in 2017. Mortgage insurance premiums are high and stress test qualifications are stringent, Taylor says, noting that individuals must also be “very well capitalized” under the minimum capital tests.
If the overnight rate is calculated at three per cent, which the government says is neutral, then the interest rate for most consumers would be 4.25 to 4.5 per cent for a five-year fixed term, he says. An interest rate at neutral or above neutral means the Bank of Canada is trying to suppress, not stimulate, activity, he says. Consumers should not face stress tests on top of a suppressive interest rate, “or we almost will be doubling down specifically on the real estate sector when trying to slow the economy.”
MPC’s recommendation is a floor of a qualifying rate of 4.5 per cent, he says. If the contract rate is lower, people should prove they can manage it; if higher, they should be able to qualify at the contract rate “because they are already paying a higher than usual interest rate . . .”
Taylor says MPC’s calculation for a stress test that is 75 basis points above contract – the equivalent of a two-per-cent interest rate hike after five years – has garnered little attention from the government. That number was arrived at partly through calculations of an increase in property equity over five years and an increase in owner’s earnings.
MPC also advocates exemptions to Guideline B-20 for mortgage renewals. Some borrowers successfully completing a five-year term can’t move their mortgage to a different lender with lower rates because they don’t qualify under the current stress test rules.
The government is aware that any changes to the insured market must be followed in the uninsured market to avoid “a dislocation in the way the market will work,” Taylor says, pointing out the government is expected to collaborate with all parties, including the Office of the Superintendent of Financial Institutions (OSFI), the Bank of Canada and Canada Mortgage and Housing Corp. on any changes to avoid the problem.
Banks have 75 per cent of market
In the CMHC Residential Mortgage Industry Dashboard released last fall, 75 per cent of outstanding mortgages were held by the banks and 0.23 per cent of those mortgages were delinquent. Taylor expects a “small percentage erosion” in the bank mortgages because of regulatory qualifications, while non-bank lenders could pick up that slack.
Credit unions and caisses populaires held 14 per cent of home mortgages, according to the CMHC report, and only had a delinquency rate of 0.16 per cent. While credit unions, (provincially regulated) are not required by law to adhere to the stress test, many boards have voted to voluntarily comply anyway, Taylor says. Meanwhile, credit union boards with laxer underwriting rules will still have to show prudence in managing depositors’ money.
The CMHC report indicates that mortgage finance companies held six per cent of the market, with a delinquency rate of 0.26 per cent rate. Mortgage investment corporations (MICs) and private lenders, meanwhile, held only one per cent of the market, with a delinquency rate of 1.92 per cent. But this sector is increasing at about 10 per cent a year versus only two per cent annual growth from other lender sectors, says Tania Bourassa-Ochoa, senior housing research specialist, CMHC.
Bourassa-Ochoa says most MICs concentrate in large metropolitan areas such as Toronto, Vancouver and Montreal.
While MICs have high interest rates, they are still “probably significantly lower” than rates negotiated with banks for unsecured lines, says Taylor. “They are performing a service that the marketplace really quite desperately needs . . . considering the contraction of credit availability of stress tests and such.”
30-year amortization
MPC advocates the reintroduction of an insurance-eligible 30-year amortization period for first-time buyers. Taylor says it would be more effective than the first-time homebuyers incentive plan in place now, which is a shared equity mortgage funded by the feds, he says.
Taylor notes that precluding people from taking on the debt of home mortgages doesn’t stop them from building other debt loads through credit cards, which have higher interest rates.
Bourassa-Ochoa says uninsured mortgages are growing faster than insured mortgages.
According to Equifax data, which covers about 80 per cent of outstanding mortgages, there are about 8.162 million mortgage holders in Canada, Bourassa-Ochoa says.
Taylor says the MPC agrees with many policy points in federal housing and CMHC strategies. Increasing purpose-built rental in hot markets such as Toronto and Vancouver will take the pressure off condominium markets to address rental demand. Purpose-built rental will also provide more security of tenancy than condominium rentals does. “It could start to ease (condo) pricing because there is lower investor demand. . .”
The MPC also supports as-of-right zoning around transit hubs such as subway stations to prevent local residents from vetoing increased densification or nodal developments. While at times property owners have legitimate concerns about developments negatively affecting their property values, NIMBYism can have a negative effect on healthy growth in cities like Toronto and Vancouver that need more affordable housing, he says. By Don Procter.
Nearly half of Canadian millennials despondent about home ownership
Almost half of Canadian millennials admitted that they are disillusioned by their financial situation, with the disenchantment largely driven by rising home prices, mounting personal debt, and stagnant salaries, according to a new poll by KPMG.
The global accountancy firm found that while 72% of those surveyed are aiming for home ownership, fully 46% of the respondents indicated a belief that their chances of owning a home are nothing more than flights of fancy.
Moreover, 46% of those who do own homes had to depend on parental finances to fulfill their down payment requirements.
“The combination of rising house prices, high levels of personal debt, and annual incomes that are just a fraction of the cost of buying a home compared with their parents’ generation, is pushing the dream of home ownership out of reach for many millennials,” KPMG national leader for human and social services Martin Joyce said, as quoted by the Financial Post.
“This is particularly challenging in the markets of Vancouver and Toronto,” Joyce added. Both markets continue to have a lop-sided effect upon Canada’s average home sales price.
KPMG’s study noted that the debt-to-income ratio among Canadians in the 23-38 age bracket is roughly 216%, compared to the 125% among members of Generation X when they were at the same age, and the 80% among baby boomers.
According to a new analysis by the non-profit housing advocacy organization Generation Squeeze, millennials need an average of 13 years to save enough just for the 20% down payment on a new home. This is far longer than the five years that the previous generation needed back in 1976.
“That’s eight fewer years that millennials might have for saving more for their retirement,” Joyce stated. “If they do manage to save up and buy a house now and delay retirement savings, our poll finds 65% of millennials fear they won’t have enough saved for retirement.” By Ephraim Vecina.
Residential Market Commentary – Alternative lenders update
The latest check-up on Canada’s residential mortgage industry shows the influence of alternative lenders continues to grow.
Canada Mortgage and Housing Corporation estimates that alternative mortgage lenders headed into 2019 with a market size of between $13 billion and $14 billion. That is up significantly from the $8 billion to $10 billion, estimated in 2016.
It is a small share of the overall market, but the important point is that it is growing. Many market watchers believe the federal stress test for mortgage borrowers is fuelling the shift away from the big banks, which still hold 75% of the business.
The most recent quarterly review by CMHC also shows that alternative lenders are taking on riskier loans in the form of second and third mortgages. The percentage of, safer, first mortgages in the portfolios of large mortgage investment corporations and mortgage investment entities dropped from 88% in 2017 to 77% in 2018. According to CMHC, that means the proportion of second and third mortgages in the portfolios is bigger.
Among large mortgage investment corporations (those with portfolios of $100 million or more) the share of debt-to-capital rose from 19% in 2017 to 22% in 2018. Among the small, alternative lenders the rate of debt-to-capital rose from 8% to 9%.
Despite the increased risk, alternative lenders have seen a decline in delinquency rates. Between 2018 and 2019 the rate slipped from 1.93% to 1.65%. By First National Financial LP.
OSFI eyeing stricter rules concerning the use of AI by banks
Canada’s Office of the Superintendent of Financial Institutions recently indicated that it might be tightening the regulations governing artificial intelligence.
Over the past few years, AI-powered solutions have been steadily deployed by banks and other financial entities as smart, cost-cutting measures.
However, this widespread adoption may expose lenders and the general public to risk, especially when it becomes more difficult to explain to stakeholders how the technology arrives at its decisions.
“AI presents challenges of transparency and explainability, auditability, bias, data quality, representativeness and ongoing data governance,” OSFI Assistant Superintendent Jamey Hubbs said last month, as quoted by the Financial Post.
“The credibility of analytical outcomes may erode as transparency and justification become more difficult to demonstrate and explain,” Hubbs added. “There may also be risks that are not fully understood and limited time would be available to respond if those risks materialize.”
In a contribution for Forbes last year, author and futurist Bernard Marr warned that potential decision-making hazards can lead to the tool doing more harm than good.
“Biased AI systems are likely to become an increasingly widespread problem as artificial intelligence moves out of the data science labs and into the real world,” he said.
“An algorithm might pick a white, middle-aged man to fill a vacancy based on the fact that other white, middle-aged men were previously hired to the same position, and subsequently promoted. This would be overlooking the fact that the reason he was hired, and promoted, was more down to the fact he is a white, middle-aged man, rather than that he was good at the job.”
Marr stressed that AI still needs intensive refinement before being rolled out for large-scale use in mortgage and other critical financial sectors.
The implications on the mortgage space are particularly serious, as AI might not consider the human circumstances that lead to problems such as delinquency or misleading documentation, only the results of such problems. By Ephraim Vecina.

Economic Highlights
Market Commentary: An update on rates and January employment numbers
Wow has the world changed since last commentary. How? Well for one, coronavirus was just a twinkle in the eye of whatever host it mutated from. Two, if I was reading Twitter correctly, World War 3 was on its way because of the Iran situation. Crazy how fast things change. Markets now are less interested on the latter and completely focused on the former. Don’t believe me? Just look at the Google trend:

*
*note: this does not include any of the 1,000 Bing users
Because remember, average consumer sentiment drives these markets!
Rates
So where have rates gone in the wake of the coronavirus pandemic? The 5 year GoC is currently yielding 1.36% while the 10 year is yielding 1.34%. The ‘belly’ of our curve is still inverted. Compared to a week ago, the 5 year was yielding 1.28% and the 10 year was yielding 1.27%. If you go back a month, around the time of our last commentary (we hear you marketing ladies), both the 5 and 10 year Government of Canada Bonds were yielding 1.63%.
Canada Mortgage Bonds are also lower than a month ago. The current 5 year CMB is yielding 1.64% and the current 10 year is yielding 1.71%. Compared to a month ago, the 5 year is 25 bps lower and the 10 year is 30 bps lower. It’s a good time as ever to explore an early rate-lock with First National. Help us, help you.
ECONOMIC NEWS
How’s the economy doing? Well better than the Bank of Canada would have you believe. The last Bank of Canada meeting and statement came off as ‘dovish’ to many in the market. If you recall, the Bank’s signaling for further potential rate cuts was focused around an extension of further weakness in data. Since then, we’ve had precisely the opposite.
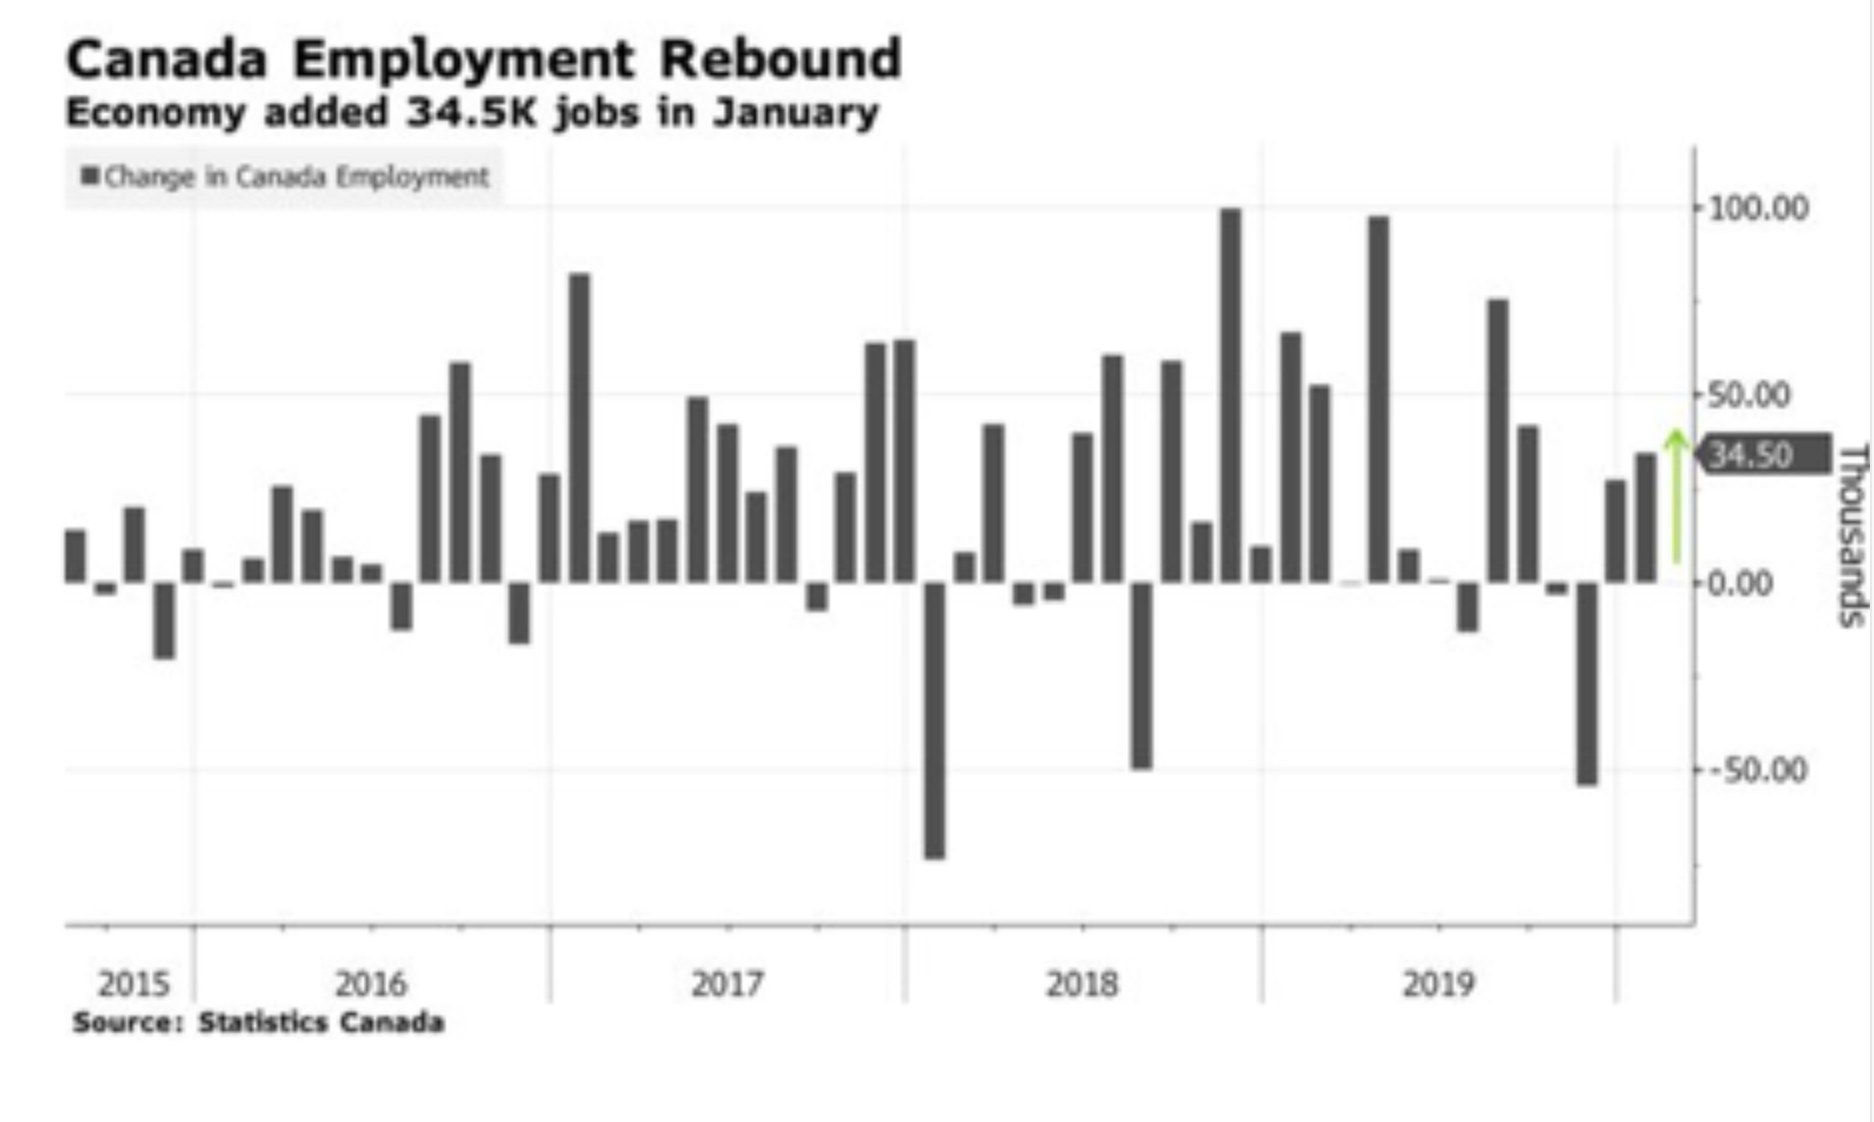
Case in point, today brought January Canadian employment numbers. The job market beat expectations adding 34.5K jobs vs the 17.5K expected. The unemployment rate also fell to 5.5%. That’s all-around good news. Full-time positions rising 35.7K was also encouraging, as was the average hourly earnings of permanent workers gaining 4.4%. If there was one negative, private sector jobs only grew +5,000 versus the public sector, which made up the majority of the job creation at 21.3K.
Today’s strong job numbers only added to the string of strong economic data that beat expectations. Retail sales, GDP and trade reports since the last Bank of Canada meeting have all exceeded market expectations. All in all, signs point for the potential for rate cuts in 2020 as being lower. The market is currently pricing a 5% chance of a rate cut on the next meeting date, March 4th.
Finally, the POTUS also known as Donald Trump was acquitted on his impeachment by the Senate this past week. With all the drama and lack of bipartisanship south of the border, I guess we can find solace that our Prime Minister’s biggest shake up has been his new beard. What will he do next? By Andrew Masliwec, Analyst, Capital Markets, First National Financial.
January Starts 2020 With Strong Canadian Job Growth
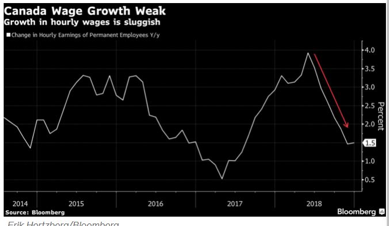
January follows December in erasing the weak November job numbers providing good news for the Canadian economy. Manufacturing led the way as the jobless rate fell, and wage growth accelerated meaningfully. The robust labour market, coupled with consumer confidence holding firm in January at about historical averages, is a reassuring sign for the resilience of the economy.
Canada’s economy created 34,500 net new jobs in January, all in full-time positions, beating economists’ expectations. The unemployment rate fell slightly to 5.5%, wage growth accelerated to 4.4%, and hours worked rose by 0.5%. This second strong reading of Canada’s job market will reinforce the Bank of Canada’s assessment of the underlying health of the Canadian economy.
Slowing activity in the second half of last year was more a function of temporary disruptions and geopolitical tensions. Some of these factors remain, augmented by the coronavirus, which has disrupted travel and trade and dramatically reduced energy and other commodity prices.
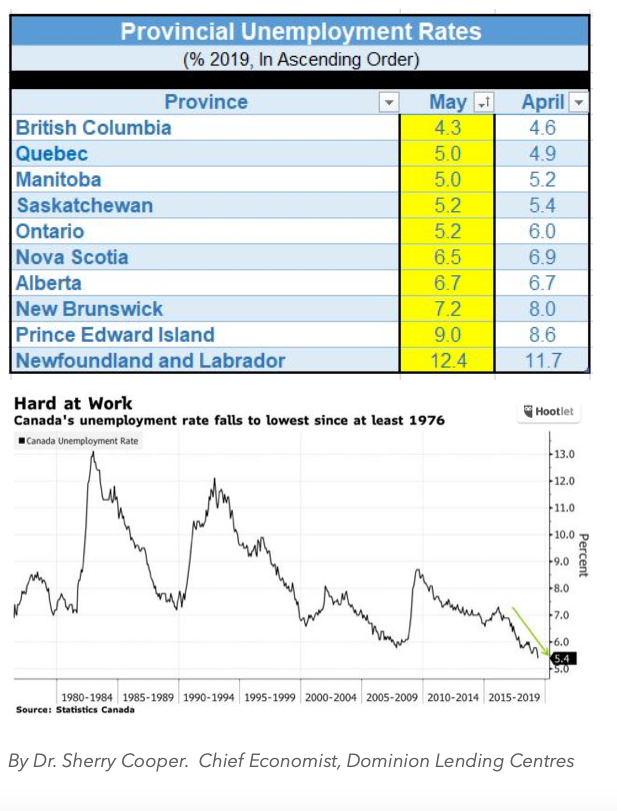
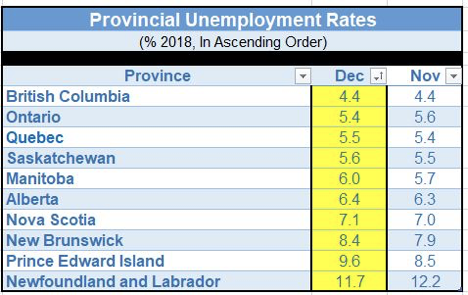
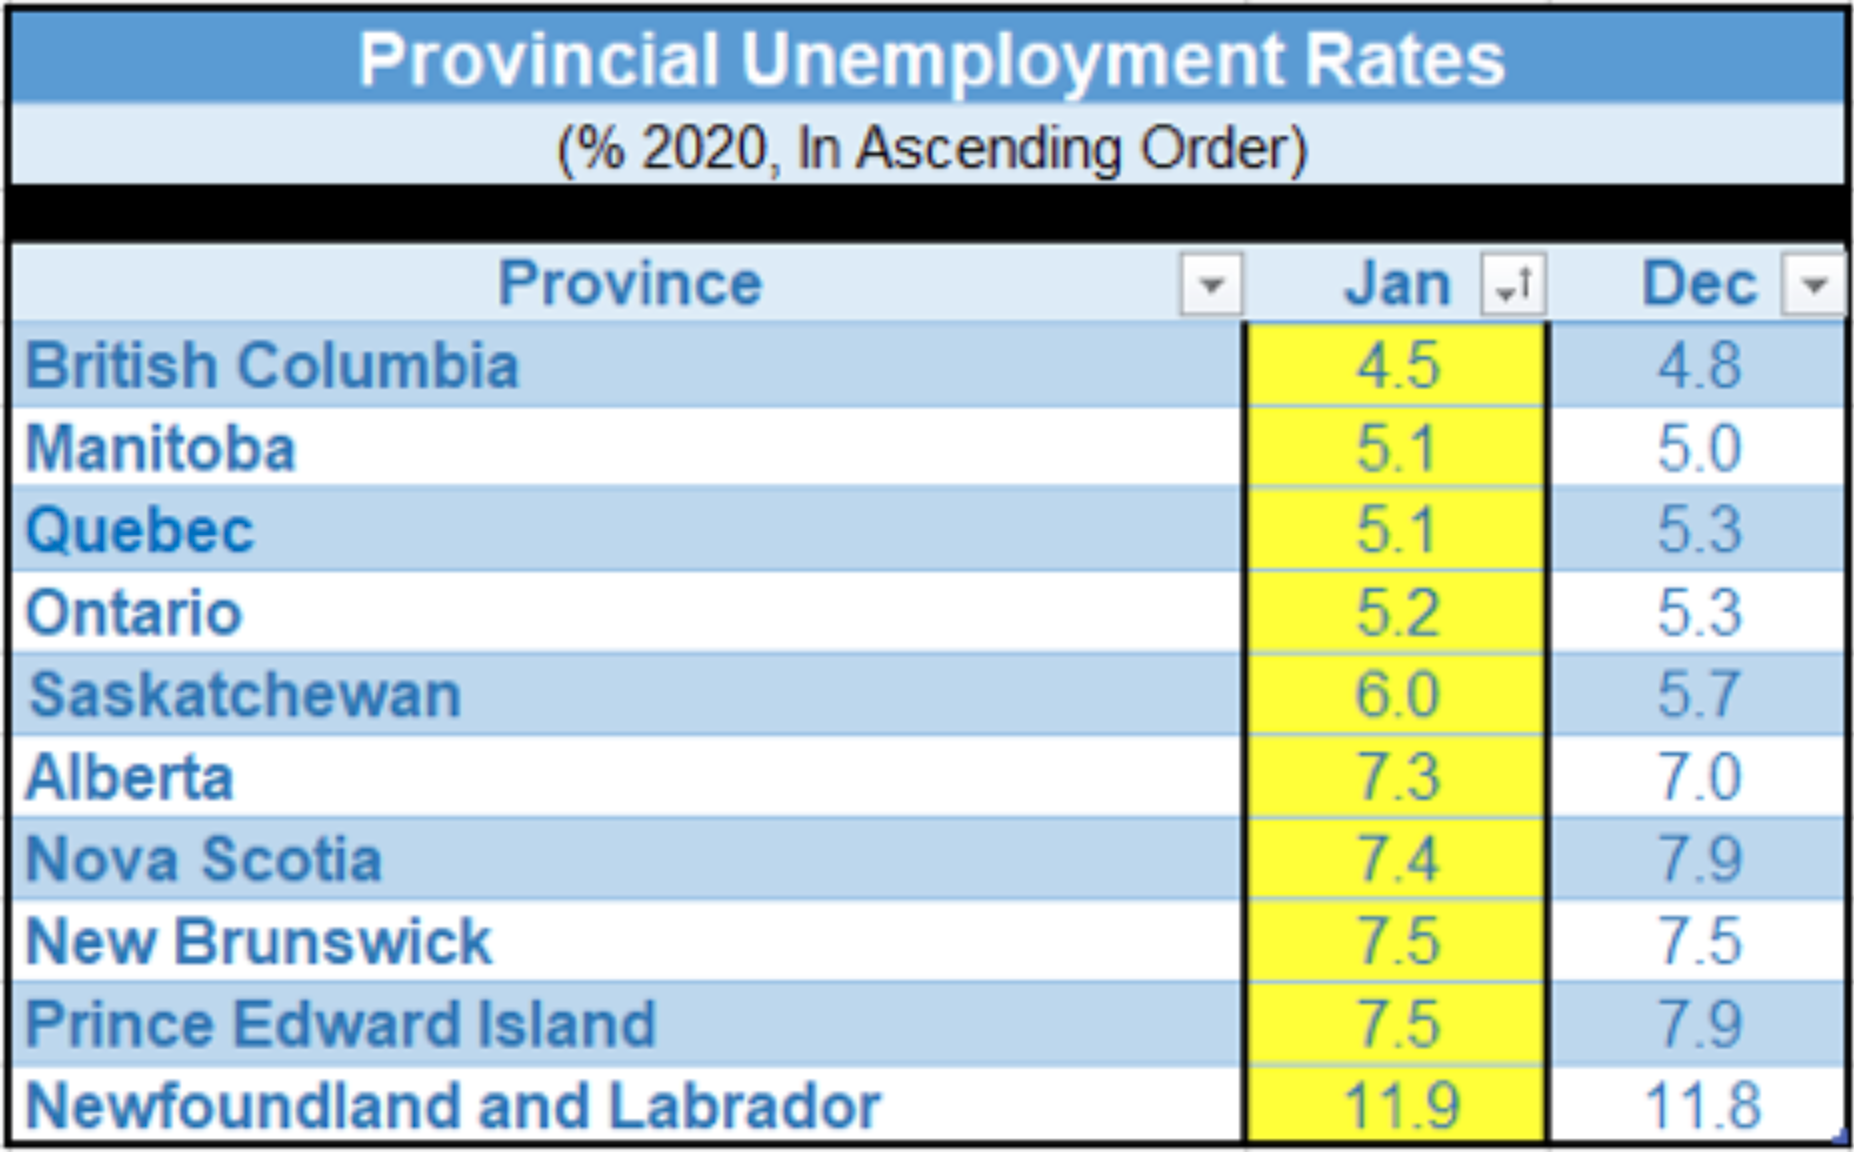
Manufacturing and construction led the job gains, and agriculture picked up as well. Quebec, Manitoba and New Brunswick posted employment gains. Fewer people were employed in Alberta, and the jobless rate spiked in Saskatchewan. The resumed decline in oil and other commodity prices has hit both prairie provinces hard.
British Columbia continued to boast the lowest unemployment rate by province, followed by Manitoba, Quebec and Ontario (See table below).
Bottom Line: Canada’s economy has been boosted by the fastest pace of immigration in the Group of Seven countries, spurring a housing boom that is pushing up demand for everything from plumbers to electricians. Indeed, Bloomberg News recently highlighted the more substantial surge in male employment in Canada relative to the US, where women have eclipsed men as the majority of jobholders.
Female job growth in Canada is also strong, and labour force participation rates are higher in Canada than in the US. The jobless rate for women age 25 and older is only 4.6% in Canada, compared to 4.9% for men.
According to Bloomberg News:
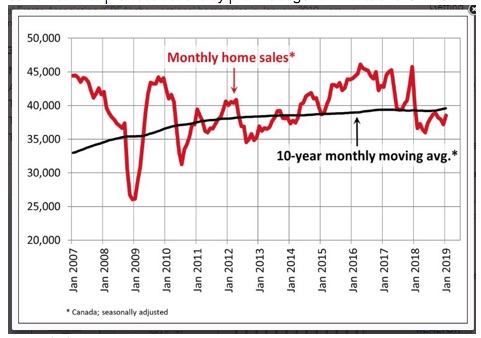
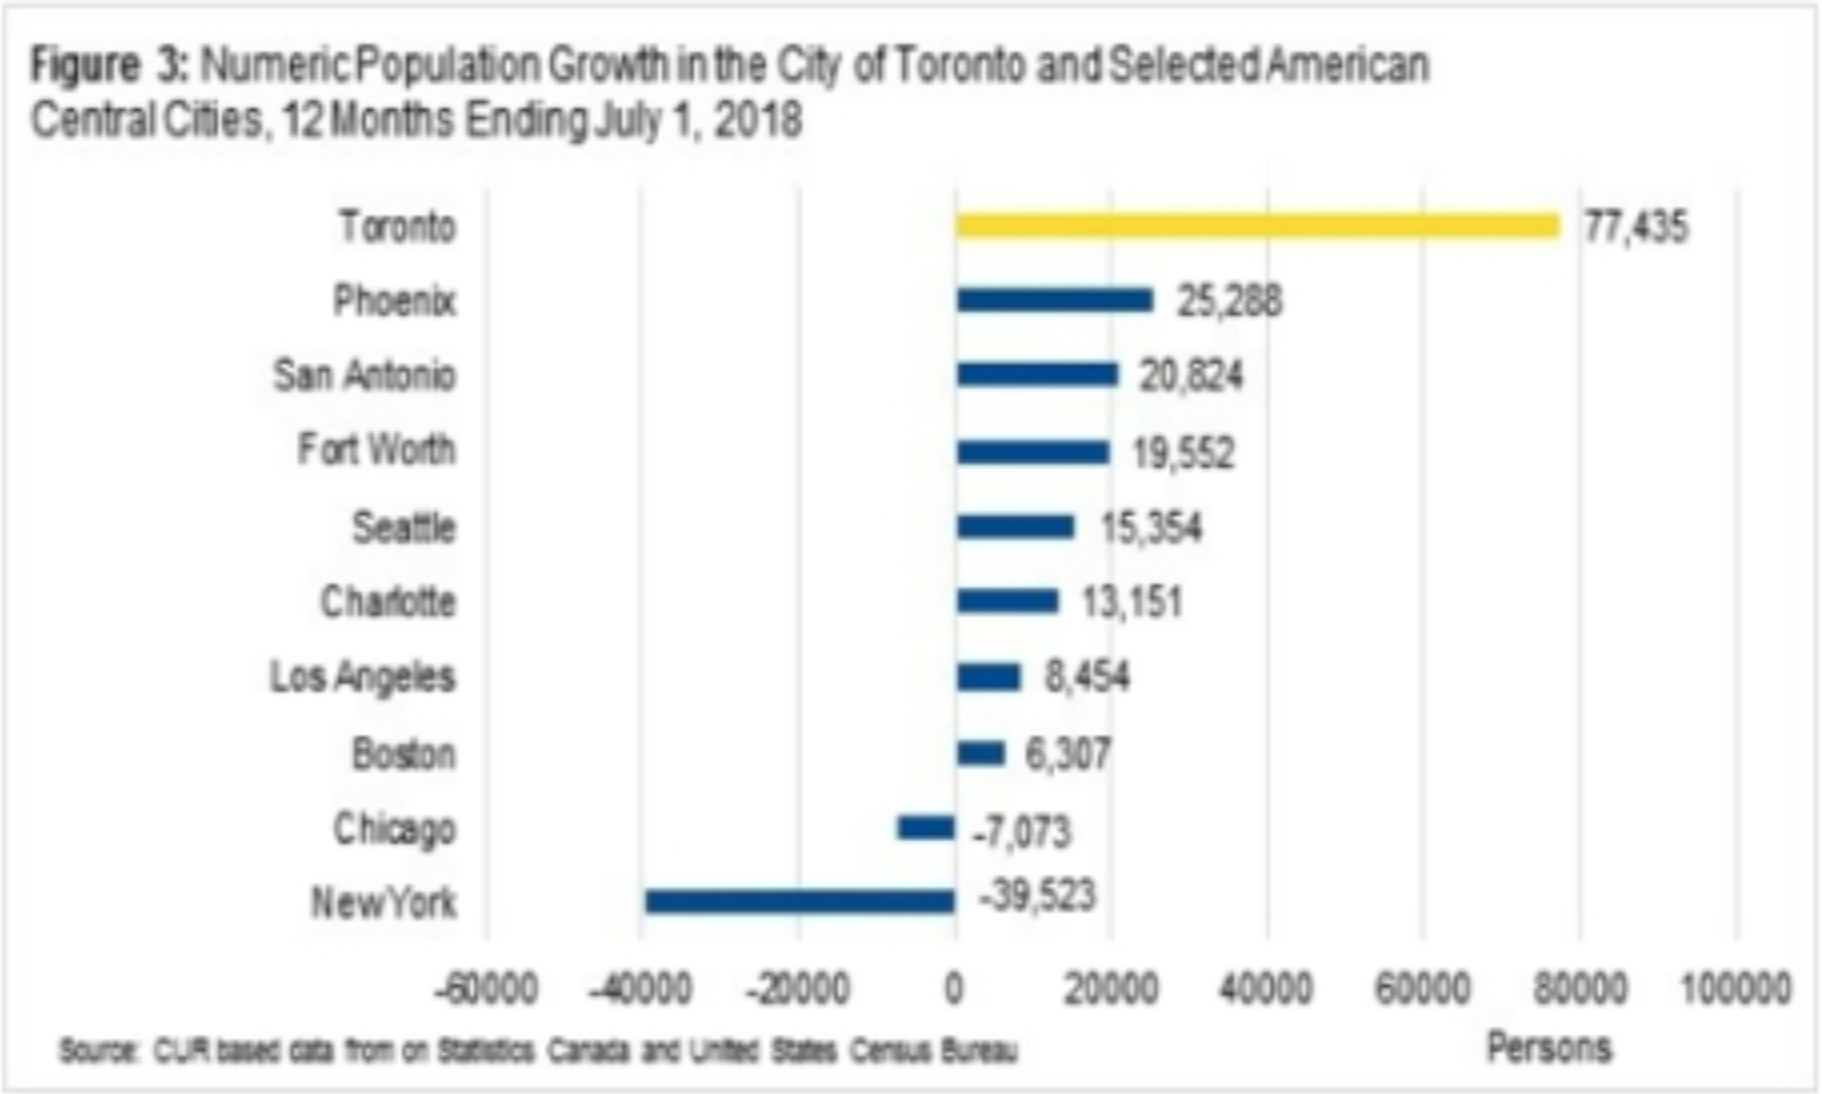
- Jared Menkes, executive vice president at Toronto-based Menkes Developments Ltd., said finding enough labour is a constant source of angst. Central Toronto posted the fastest-growing population in North America last year with a dozen office buildings and countless condos under construction, along with 25 light rail stations, hospitals and all sorts of infrastructure work (see chart below). “We are short actual labour, whether it’s a crane operator, whether it’s drywallers, electricians, plumbers, drivers,” Menkes said. “We’re short truck drivers, architects, consultants.”
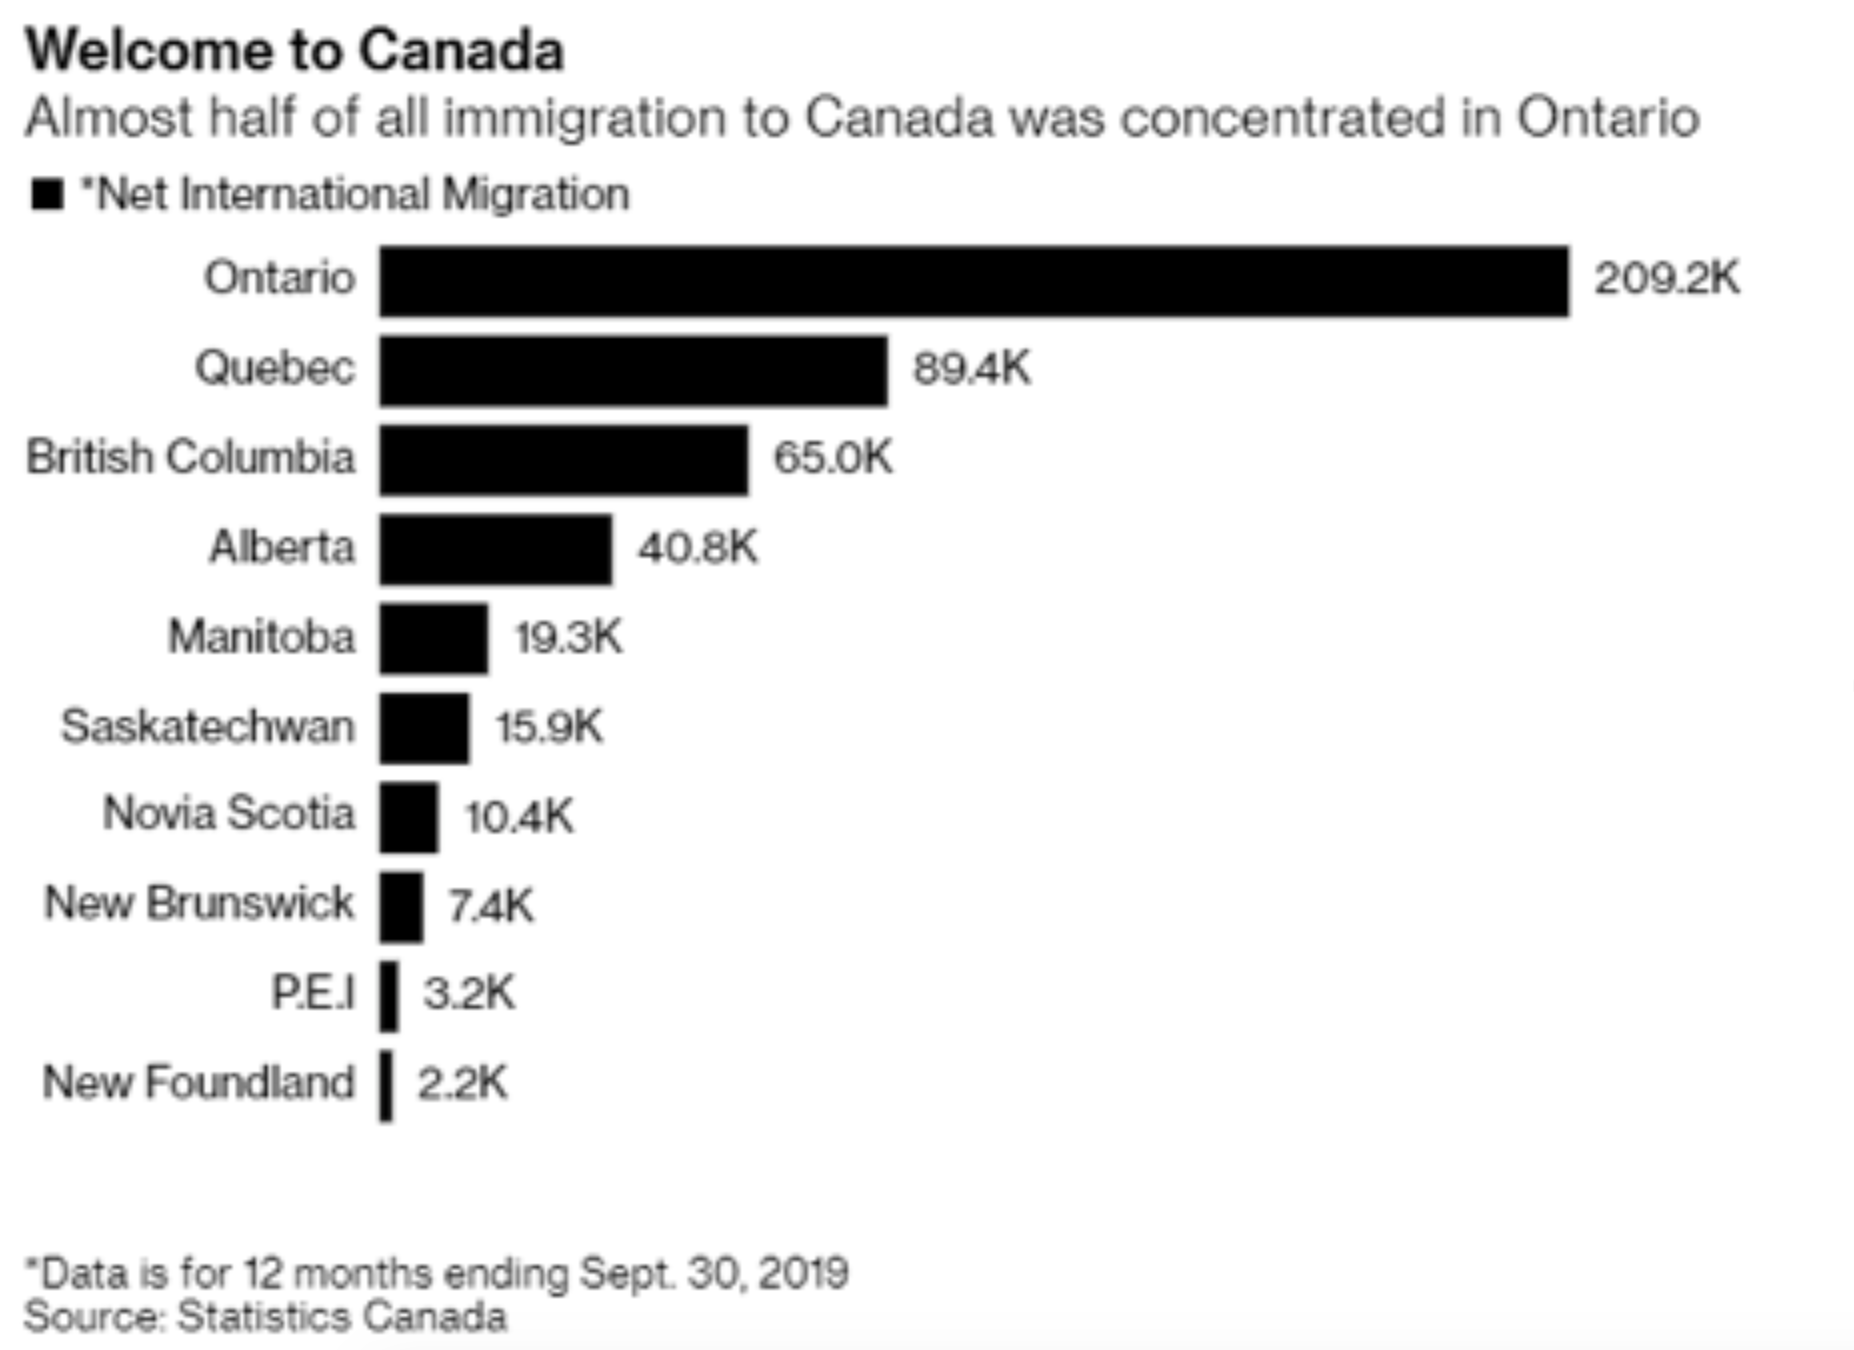
Roughly half of all immigrants to Canada located in Ontario, but as the second chart below shows, Quebec and British Columbia garnered their fair share of new residents as well. The Bank of Canada highlights this factor in suggesting that the economy will continue to grow in 2020 and 2021. Certainly, it is a strong positive for the housing markets in these provinces.
By Dr. Sherry Cooper. Chief Economist, Dominion Lending Centres
![]()
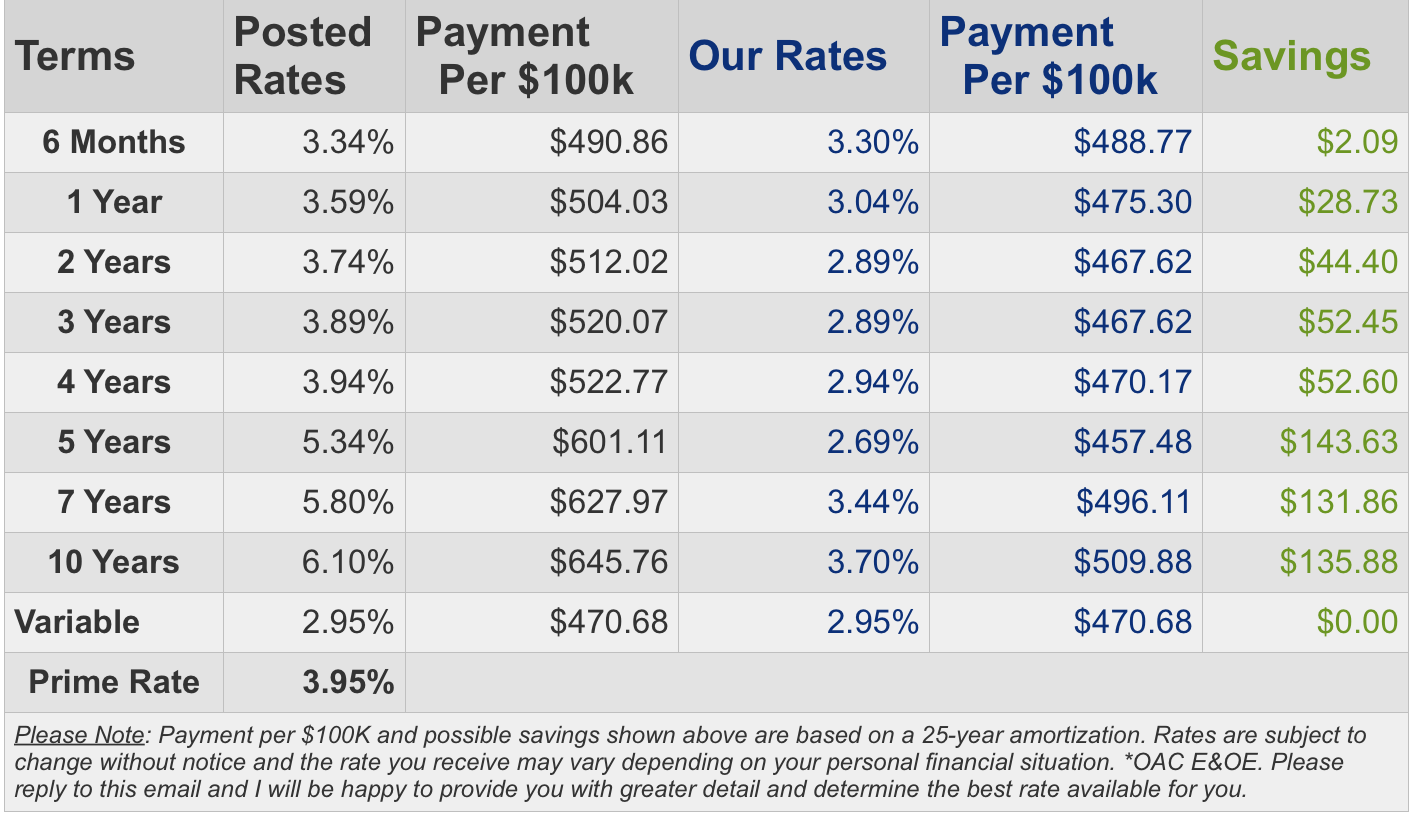
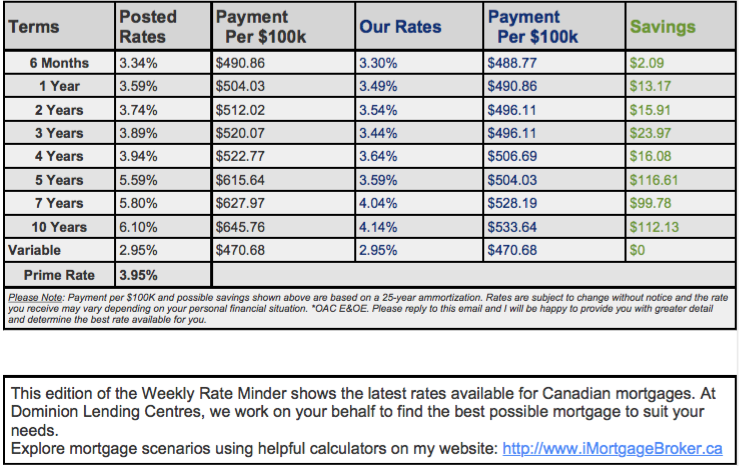
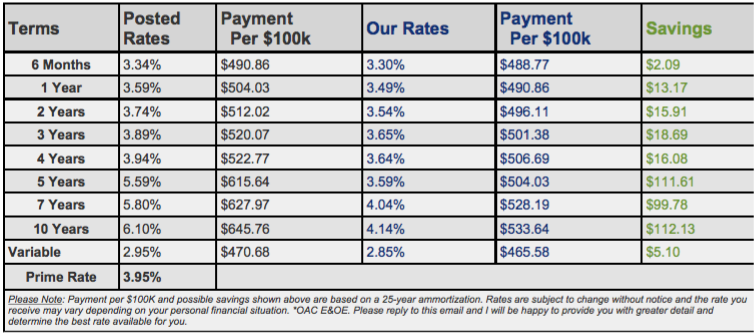
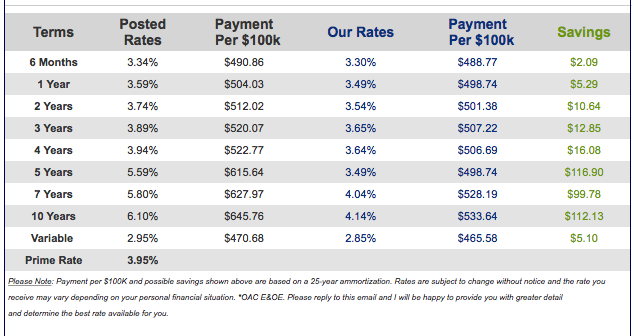
Mortgage Interest Rates
Prime lending rate is 3.95%. Bank of Canada Benchmark Qualifying rate for mortgage approval is still at 5.19% but the pressure is on to see if other Banks and the BOC will follow suit now that TD Bank lowered its 5 year posted rate to 4.99%. Changes to the mortgage qualifying rate is coming into effect April 6, 2020: Instead of the Bank of Canada 5-Year Benchmark Posted Rate, the new benchmark rate will be the weekly median 5-year fixed insured mortgage rate from mortgage insurance applications, plus 2%.
Fixed rates are moving down slowly with lower bond yields. Deep discounts are offered by some lenders for variable rates making adjustable variable rate mortgages somewhat attractive, but still not a significant enough spread between the fixed and variable to justify the risk for most.
Mortgage Update – Mortgage Broker London
Ensure that your current mortgage is performing optimally, or if you are shopping for a mortgage, only finalized your decision when you are certain you have all the options and the best deals with lowest rates for your needs.
Here at iMortgageBroker, we love looking after our clients needs to ensure your best interest is protected. We do this by shopping your mortgage to all the lenders out there that includes banks, trust companies, credit unions, mortgage corporations & insurance companies. We do this with a smile, and with service excellence!
Reach out to us – let us do all the hard work in getting you the best results and peace of mind!