
![]()
Market CommentaryCREA StatsHome sales ended 2017 with a rise in sales ahead of the mortgage stress test which came in at the start of the New Year.The Canadian Real Estate Association says that there was a 4.5% increase in nationwide home sales in December compared with November, marking their fifth consecutive monthly rise.Activity increased in almost 60% of local markets with the GTA, Edmonton, Calgary, the Fraser Valley, Vancouver Island, Hamilton-Burlington and Winnipeg leading the gains.Actual (not seasonally adjusted) activity was up 4.1% year-over-year. Annual gains were strongest in the Lower Mainland of British Columbia, Vancouver Island, Calgary, Edmonton, Ottawa and Montreal. The GTA saw a decline.“National home sales in December were likely boosted by seasonal adjustment factors and a potential pull-forward of demand before new mortgage regulations came into effect this year,” said Gregory Klump, CREA’s Chief Economist. “It will be interesting to see if monthly sales activity continues to rise despite tighter mortgage regulations that took effect on January 1st.”New supply of homes in the GTA pushed new listings nationwide up 3.3% but inventory remained subdued at 4.5 months of supply.CREA’s aggregate home price index was up 9.1 year-over-year in December, the smallest increase since February 2016 and the 8th consecutive slowdown of price increases.Bank of Canada Rate Increase AnnouncedThe Bank of Canada today increased its target for the overnight rate to 1 1/4 per cent. The Bank Rate is correspondingly 1 1/2 per cent and the deposit rate is 1 per cent.Growth in the Canadian economy is projected to slow from 3 per cent in 2017 to 2.2 per cent this year and 1.6 per cent in 2019.The Press Release and the Report are now available on the Bank of Canada’s websiteIs There Another Rate Increase on the Horizon?The Bank of Canada will make its first interest rate announcement of 2018 this week and the majority prediction is that there will be an increase.The December employment numbers seem to have been the final switch that needed to be flipped to green-light an increase. The creation of nearly 80,000 jobs and a 5.7% unemployment rate – the lowest since comparable records have been kept starting in 1976 – were enough to tamp-down growing uncertainty about the fate of the NAFTA renegotiations.The bond market certainly sees the jobs picture as bright and yields on Government of Canada five-year notes jumped, triggering a round of increases in five-year fixed mortgage rates at the big banks.Along with employment, the long-term view is focused on inflation. At 2.1%, it is pretty much where the Bank of Canada wants it. There are expectations that wage growth will put some upward pressure on inflation but bigger economic factors like debt, a growing number of retirees and technological efficiencies will likely temper rising prices.If the expected rate increase comes on Wednesday most analysts anticipate a fairly long hold before the next hike. The BoC remains very concerned about high levels of household debt and it remains to be seen how the new mortgage stress test will affect the housing market. Economists who had been predicting three rate hikes this year are dialing that back to just a pair of increases. By First National Financial.Households Struggle as Lender Hike RatesIf the Bank of Canada decides to increase interest rates this week it will pile further pressure on millions of already-struggling households, while some lenders are already making changes to rates.A survey from insolvency firm MNP reveals that almost half of respondents are within $200 of being unable to meet their monthly financial obligations.The report shows that a third of households are already unable to meet their monthly costs with a similar share concerned about their levels of debt, 38% regretting taking on so much debt, and 55% not expecting to have a debt-free retirement.Four in ten Canadians are concerned that they would be in financial trouble if interest rates rise much more; a third could be facing insolvency.The Financial Post reports that RBC, TD and CIBC have all increased mortgage rates with 5-year fixed rate loans now above 5%.Many economists are expecting BoC Governor Stephen Poloz to announce the first interest rate rise of 2018 on Wednesday.December Homes Sales Surged In Advance of New Mortgage Rules

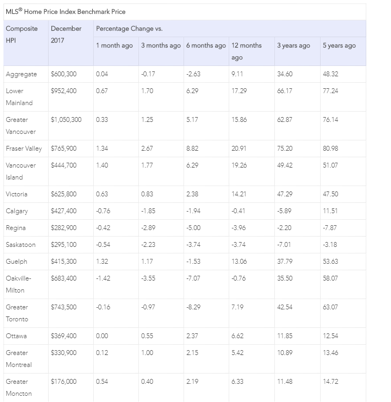
The January 1 implementation of the new OSFI B-20 regulations requires that uninsured mortgage borrowers be stress-tested at a mortgage rate 200 basis points above the contract rate at federally regulated financial institutions. It is no surprise that home sales rose in advance of the new ruling in November and December. Even so, activity remains below peak levels earlier in 2017 and prices continued to fall in the Greater Toronto Area (GTA) and in Oakville-Milton, Ontario for the eighth consecutive month. Prices also fell last month in Calgary, Regina, and Saskatoon–cities that have suffered the effects of the plunge in oil and other commodity prices beginning in mid-2014.Mortgage Rates Are RisingEver since the release of exceptionally strong yearend employment data for Canada on January 5th, there has been a widespread expectation that the Bank of Canada would hike the target overnight interest rate by 25 basis points this Wednesday, taking it to 1.25 percent. Indeed, market rates have already risen in response to this expectation. The Royal Bank was the first to hike its posted 5-year fixed mortgage rate to 5.14 percent last Thursday, up from 4.99 percent. Other banks quickly followed suit.It used to be that a hike in the posted rate was of little consequence because borrowers’ contract rates were typically much lower. However, government regulations put in place in October 2016 now force borrowers with less than a 20 percent down payment to qualify at the posted rate. And the new OSFI regulations effective this year now require even those with more than a 20 percent down payment to qualify at a rate 200 basis points above the contract mortgage rate at federally regulated financial institutions.It has been four years since the posted five-year fixed mortgage rate exceeded 5 percent. And it has been nearly a decade since homebuyers had to qualify at contract mortgage rates that high–when government stress-testing rules didn’t exist. A decade ago, house prices in Canada’s major cities were substantially lower. Indeed, as the table below shows, house prices in the Greater Vancouver Region, Fraser Valley and the Lower Mainland of British Columbia have increased by nearly 80 percent in just the past five years. In the GTA, home prices are up over 60 percent over the same period. These price gains dwarf income increases by an enormous margin. So clearly, housing affordability has plummeted and the combination of tightening regulations and rising interest rates will no doubt dampen housing activity.This is one factor that could weaken the case for a Bank of Canada rate hike this week. Another is the potential failure of NAFTA negotiations–a threat to three-quarters of Canada’s exports. Additionally, inflation remains low and wage gains–though rising–are still quite moderate.Hence the case for a Bank of Canada rate hike this week is not incontestable.U.S. market interest rates have risen significantly this year, and many bond traders are now forecasting the end of the secular bull market in bonds as the U.S. economy approaches full-employment and fiscal stimulus (the recent tax cuts) will boost the federal budget deficit.December Home Sales RiseThe Canadian Real Estate Association (CREA) reported today that national home sales jumped 4.5% from November to December–their fifth consecutive monthly increase. Activity in December was up in close to 60% of all local markets, led by the GTA, Edmonton, Calgary, the Fraser Valley, Vancouver Island, Hamilton-Burlington and Winnipeg.While activity remained below year-ago levels in the GTA, the decline there was more than offset by some sizeable y-o-y gains in the Lower Mainland of British Columbia, Vancouver Island, Calgary, Edmonton, Ottawa and Montreal.New Listings Shot UpMany sellers decided to list their properties ahead of the mortgage rule changes. The number of newly listed homes rose 3.3% in December. As in November, the national increase was overwhelmingly due to rising new supply in the GTA. New listings and sales have both trended higher since August. As a result, the national sales-to-new listings ratio has remained in the mid-to-high 50% range since then.A national sales-to-new listings ratio of between 40% and 60% is consistent with a balanced national housing market, with readings below and above this range indicating buyers’ and sellers’ markets respectively. That said, the balanced range can vary among local markets.Considering the degree and duration that the current market balance is above or below its long-term average is a more sophisticated way of gauging whether local housing market conditions favour buyers or sellers. Market balance measures that are within one standard deviation of the long-term average are generally consistent with balanced market conditions. Based on a comparison of the sales-to-new listings ratio with its long-term average, more than two-thirds of all local markets were in balanced-market territory in December 2017.The number of months of inventory is another important measure of the balance between housing supply and demand. It represents how long it would take to liquidate current inventories at the current rate of sales activity.There were 4.5 months of inventory on a national basis at the end of December 2017. The measure has been moving steadily lower in tandem with the monthly rise in sales that began last summer.The number of months of inventory in the Greater Golden Horseshoe region (2.1 months) was up sharply from the all-time low reached in March 2017 (0.9 months). Even so, the December reading stood a full month below the regions’ long-term average (3.1 months) and reached a seven-month low.Price Pressures EasedThe Aggregate Composite MLS® Home Price Index (HPI) rose by 9.1% year-over-year (y-o-y) in December 2017 marking a further deceleration in y-o-y gains that began in the spring of last year and the smallest increase since February 2016. The slowdown in price gains mainly reflects softening price trends in the Greater Golden Horseshoe housing markets tracked by the index, particularly for single-family homes. On an aggregate basis, only single-family price increases slowed on a y-o-y basis. By comparison, y-o-y price gains picked up for townhouse/row and apartment units.Apartment units again posted the most substantial y-o-y price gains in December (+20.5%), followed by townhouse/row units (+13%), one-storey single family homes (+5.5%), and two-storey single family homes (+4.5%).
By Dr. Sherry Cooper. Chief Economist, Dominion Lending CentresWhat Happens to Stocks When the Bull Market EndsYou undoubtedly know that 2017 was a record-setting year for the broad stock markets. And while gold was up last year despite numerous headwinds, most mainstream investors aren’t paying much attention to gold since they keep seeing so much green in their stock portfolios.Even I was taken back by some of the data from the bull market in stocks…
- The Dow hit a record high 71 times last year. On average, a new high was hit more frequently than once a week.
- For the first time ever in its almost 90-year history, the S&P 500 rose every month in 2017. And historically there have only been four years with gains in 11 months of the year.
- The S&P’s largest pullback in 2017 was 2.8%, the smallest since 1995.
- To start 2018, the S&P 500 has risen in each of the five trading sessions, hitting a new record high every day. The last time the index opened the year with at least five straight record highs was 1964.
This all begs the question: is the bull market about to come to an end?• And as Mike pointed out in his 2018 predictions, the CAPE (Cyclically Adjusted Price-Earnings) ratio has now matched its 1999 level, the second highest reading in over 100 years of data. The CAPE now has a higher reading only in 1929.This all begs the question: is the bull market about to come to an end? This is exactly the kind of frothy behavior a market sees near its apex, so it’s definitely a prudent question to ask. If last year ends up being the top of this bull market, what does history say could happen to stocks this year?We dug up the data for all bull markets in the S&P since the year 1900, and then examined what happened in the very first year after each of those bull markets ended. In other words, what did the first year of the bear market look like after the last full year of the bull market? This could be useful data, if 2017 ends up being the peak of the bull market.Here’s what history shows.First Year Performance of Bear Market After Bull Market Ends
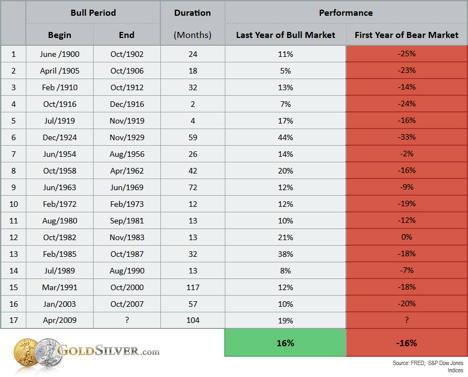
While the declines for the first year of the bear market varied greatly, you can see that on average, the S&P lost 16% the year immediately following the last year of the bull market. Also notice that in only four cases was the decline measured in single digits—all others were double digit losses.Mike Maloney believes this is the year overvalued stocks begin their descent. If he’s right, the decline could be higher than the historical average, since this is the second longest bull market in history.And what is gold likely to do in that environment? We’ve shown before that gold has acted as a buffer—and gained ground—in most of the biggest stock market crashes.The bottom line for us is that we think a major shift is coming, not just in overpriced stock and bond and real estate markets, but in the currencies that have been abused by many central bankers the world over. Once the process gets underway, the mainstream will turn back to mankind’s oldest form of money in mass, and our patience and forethought will pay off. By Jeff Clark, Senior Precious Metals Analyst, GoldSilver.Economic HighlightsAre the good times really over for good?Recently, for the first time since 2012 we have seen the 5-year bond market climb back up over 2.0%. Based on amazing employment numbers and the likelihood that the Bank of Canada will raise rates on January 17, the bond market has continued a climb out of the basement and maybe running full steam uphill in response to a better economy.Let’s look at the last 10-years of bonds and how they correlated to the 5-yr. fixed mortgage rate because it is still the choice of most Canadians as it is a stable place to build your home budgets around. In 2007 the 5-year bond was at 4.13% and the 5-year benchmark rate 6.65%. Follow the melt down that started to happen in 2008 the bond slowly but surely began to sink and by 2012 the 5-yr. bond was at 1.25% and the bench mark 5 yr. rate was at 5.29%. But wait we weren’t done; in 2015 the bond sunk all the way to .65% but the bench mark rate was still at 4.74%, if you took that rate at the branch you really paid too much as we were almost at 2.25% for standard feature 5 year fixed at that time.So now turn the corner and we see that the bond is on its way back up. We come into 2018 with it having climbed all the way back to 2% almost an 8-year high and of course Governor Poloz has already had the bench mark at 4.99 so I don’t think it will be long before we see the bench mark reset again. Will it be long before the new qualifying numbers are 6% again, still some factors to watch, NAFTA, employment, world markets, price of tea in China, price of oil in Alberta. By Len Lane.
![]()
RatesIncrease to prime lending rate currently at 3.45%. Bank of Canada Benchmark Qualifying rate for mortgage approval is at 4.99% but expected to increase again soon. 15 Basis point (0.15%) increase in fixed rates. 25 Basis point (0.25%) increase in variable rates.
Other NewsworthyOpen Access• Real-estate market faces ‘significant test’ (Toronto Star)• Canadian real estate market outlook 2018 (Maclean’s)• Renters pushed to the 905 as vacancies hit 16-year low: Report (Toronto Star)Subscription May Be Required• One-third of Canadians can’t pay monthly bills as interest rates set to rise, survey suggests (Globe and Mail)• Canadian home prices rise in 2017 as B.C. boom offsets weaker Ontario sales (Globe and Mail)• Can more housing supply resolve the affordability crisis in Vancouver? (Globe and Mail)• Go ahead, jump on the Bank of Canada interest rate hike bandwagon — there’s plenty of reason to (Financial Post)• Before reading Bank of Canada tea leaves, be sure the pot has boiled (Financial Post)• Priced out of urban areas, millennials opt for the cottage (Globe and Mail)• Got $2,166 a month? — you’ll need it to rent a condo in Toronto, if you can find one (Financial Post)